Fig. 6
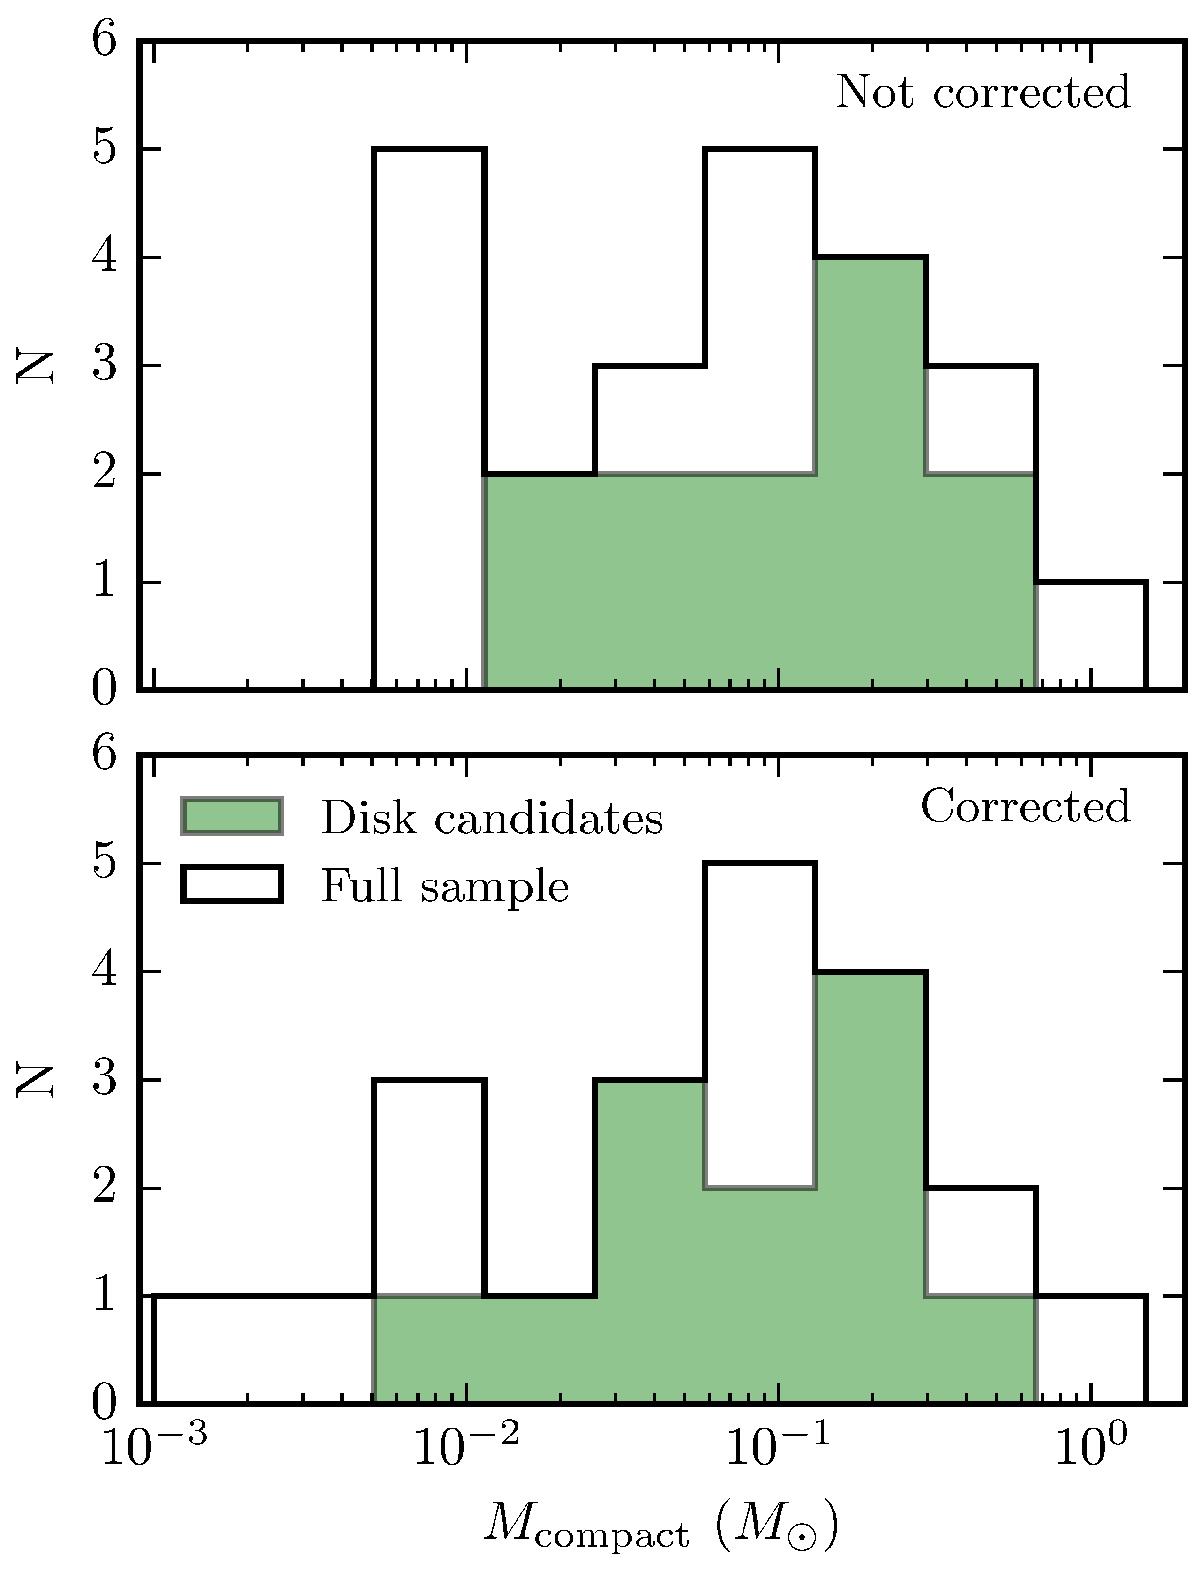
Histograms of compact masses inferred from continuum flux densities at baselines >40 kλ. The black histograms show the full sample while the shaded histograms show only the sources that are identified as disk candidates in Table 4. The top panel shows uncorrected compact masses, while the bottom panel shows compact masses corrected for the envelope contribution using the method of Jørgensen et al. (2009).
Current usage metrics show cumulative count of Article Views (full-text article views including HTML views, PDF and ePub downloads, according to the available data) and Abstracts Views on Vision4Press platform.
Data correspond to usage on the plateform after 2015. The current usage metrics is available 48-96 hours after online publication and is updated daily on week days.
Initial download of the metrics may take a while.