Fig. 5
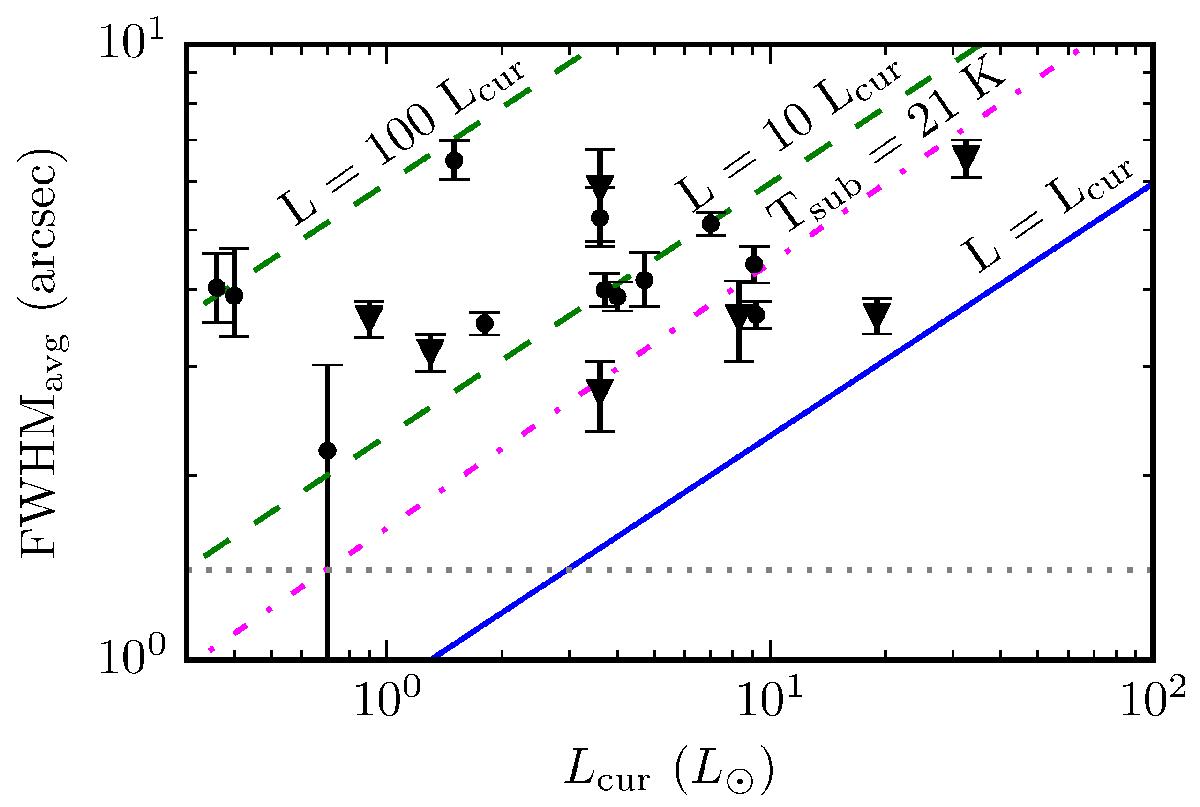
Measured C18O extents versus the current (bolometric) luminosity. Triangular symbols represent sources that are associated with a companion protostar at a projected distance <0.8′′. The error-bars indicate the statistical uncertainties of the measurements listed in Table 3. The uncertainties of the luminosities are not shown to avoid cluttering the diagram, but they are small enough that they do not influence the conclusions. The solid line represents the expected CO extent given the current luminosity and a CO sublimation temperature of 28 K, while the dashed lines represent the expected CO extents for 10 and 100 times the current luminosity. The dash-dot line shows the expected CO extent for a sublimation temperature of 21 K. The horizontal dotted line at 1.4′′ indicates the lower limit of the extents that can be measured given the baseline coverage and sensitivity of the observations.
Current usage metrics show cumulative count of Article Views (full-text article views including HTML views, PDF and ePub downloads, according to the available data) and Abstracts Views on Vision4Press platform.
Data correspond to usage on the plateform after 2015. The current usage metrics is available 48-96 hours after online publication and is updated daily on week days.
Initial download of the metrics may take a while.