Fig. 4
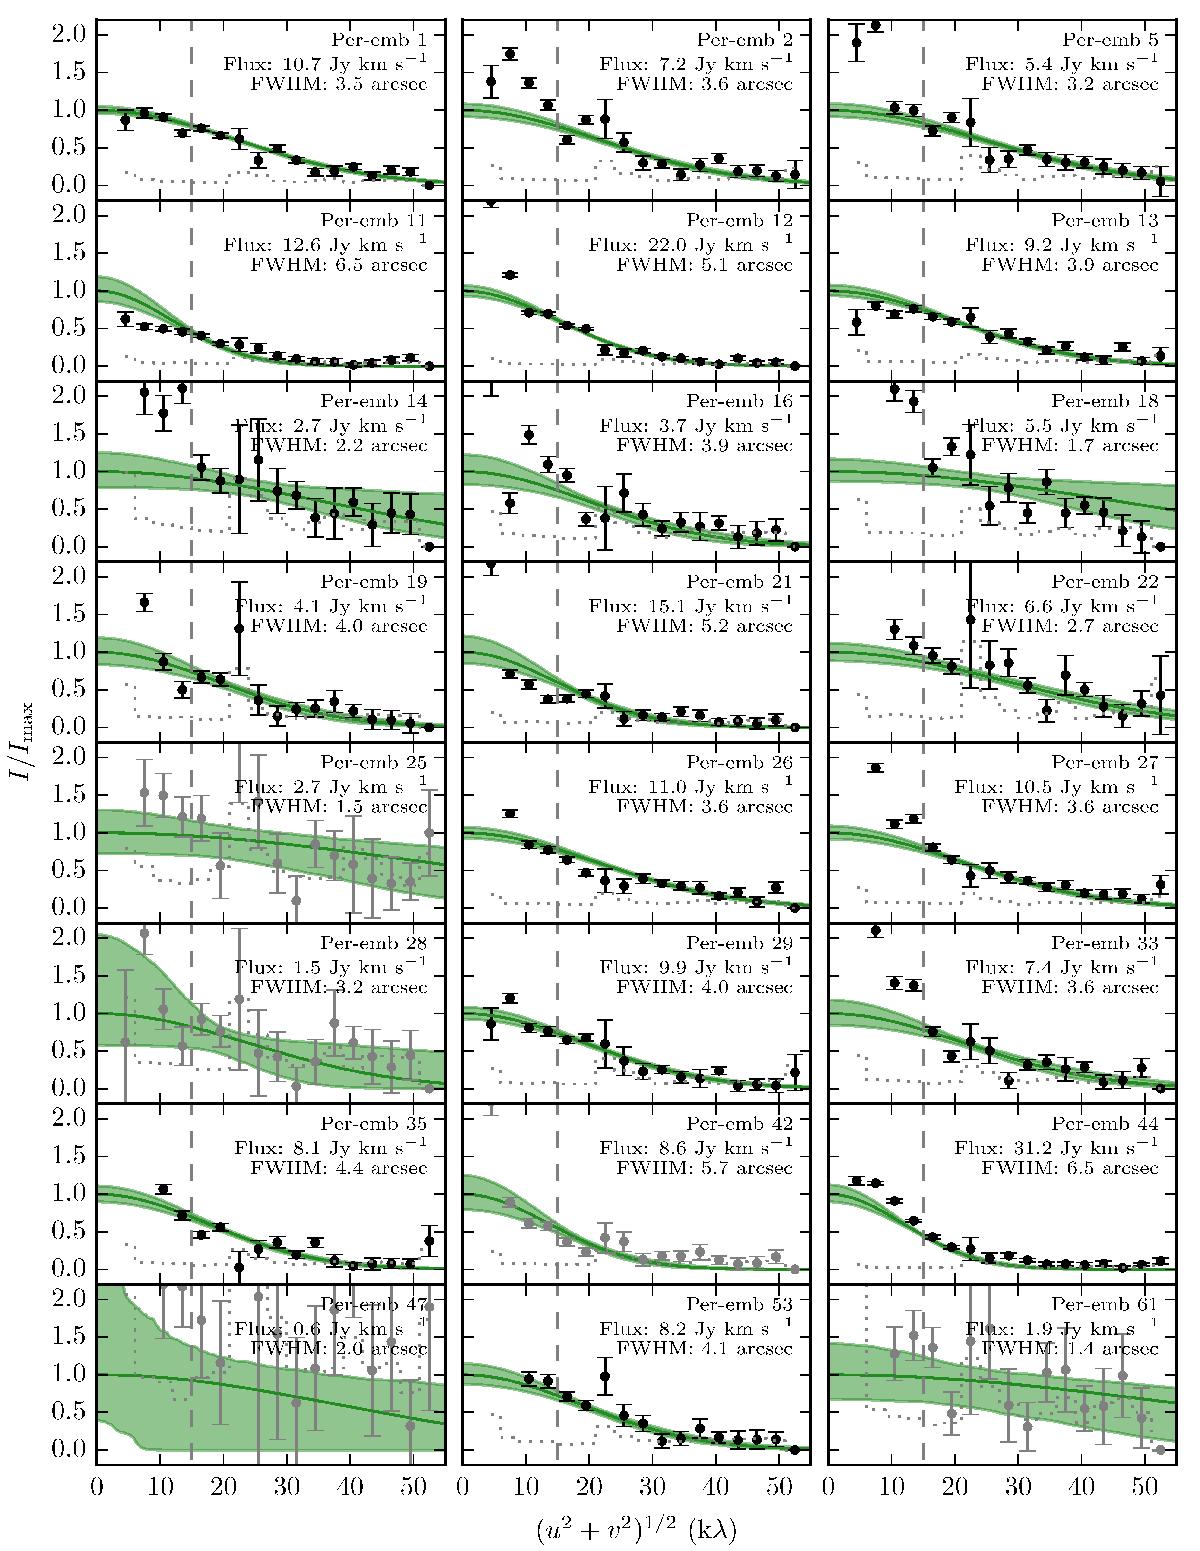
(u,v)-amplitude plots of the integrated C18O emission towards the sources in the observed sample. The grey dotted histograms in each panel indicate the expected amplitude in the absence of any source emission. The solid green line in each panel represents the best fitting Gaussian, while the shaded region indicates the 1σ uncertainty region of the fit. The vertical axis of each panel has been scaled to the Gaussian’s peak flux, whose value is printed in the upper right. The grey dashed lines indicate the 15 kλ lower boundary of the fit. Panels where the (u,v)-amplitudes have been plotted in grey indicate objects whose fits have been rejected (see text for details).
Current usage metrics show cumulative count of Article Views (full-text article views including HTML views, PDF and ePub downloads, according to the available data) and Abstracts Views on Vision4Press platform.
Data correspond to usage on the plateform after 2015. The current usage metrics is available 48-96 hours after online publication and is updated daily on week days.
Initial download of the metrics may take a while.