Fig. 2
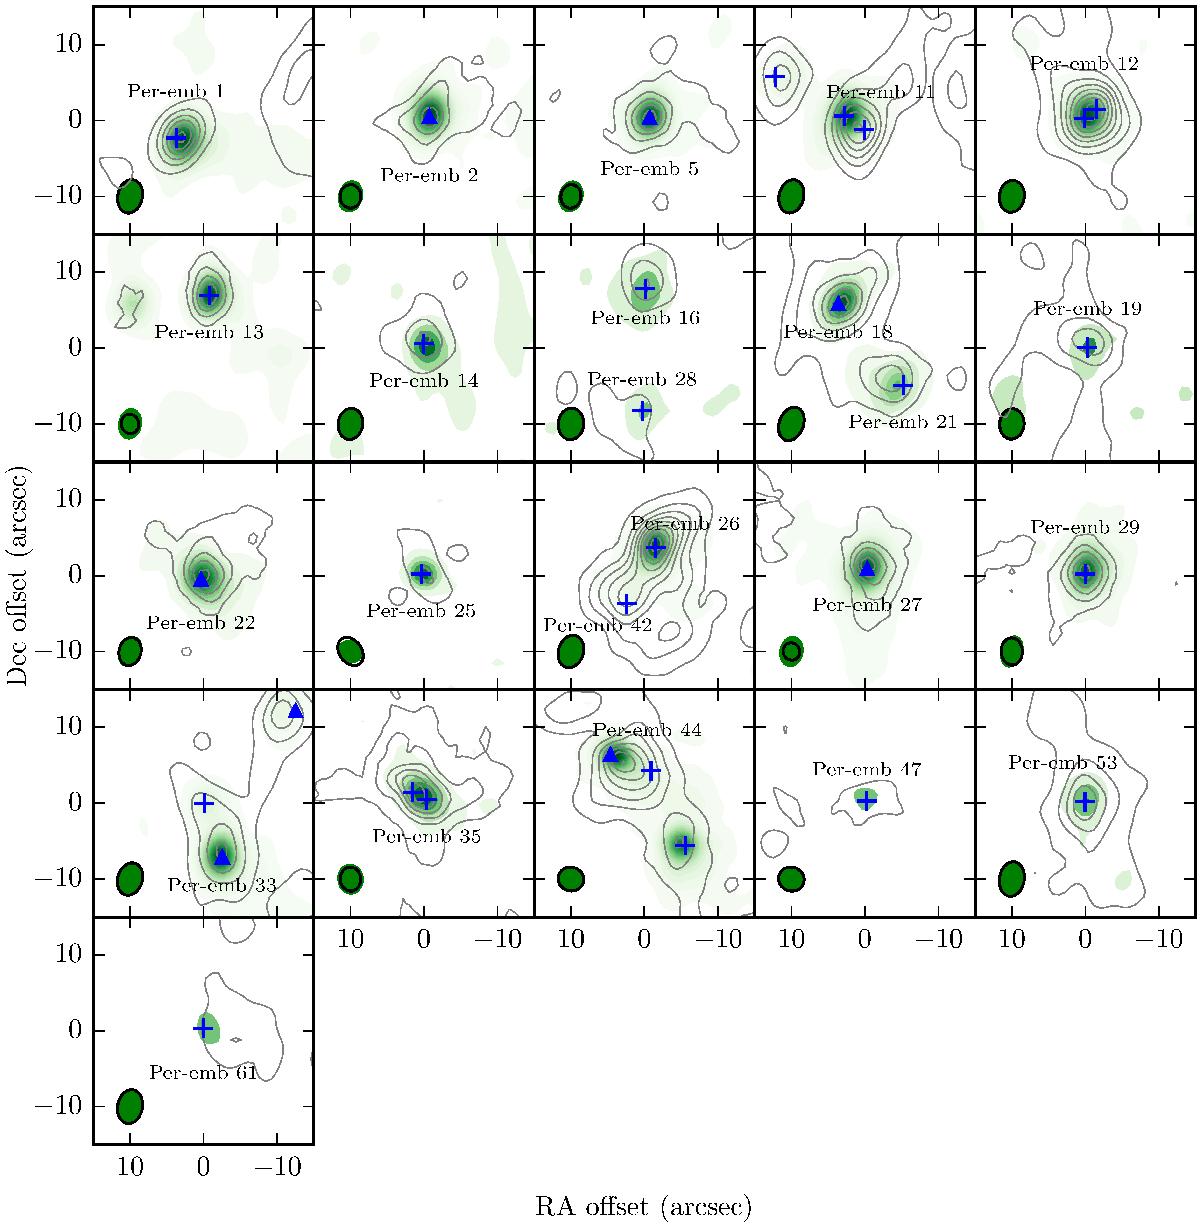
Maps of C18O 2–1 integrated emission (line contours) and 1.3 mm continuum emission (colour map). Contours are drawn starting from 3σ in steps of 6σ (see Table 2 for C18O and continuum 1σ rms sensitivities). Synthesised beams of the C18O and continuum emission are shown in the lower left corners as respectively black and a shaded ellipses. Note that the beam sizes only differ significantly for the targets where extended data is available for the C18O emission. The blue symbols mark the source positions from the VANDAM survey (Tobin et al. 2016), with crosses indicating single protostars and triangles indicating multiple systems with projected separations <0.8′′.
Current usage metrics show cumulative count of Article Views (full-text article views including HTML views, PDF and ePub downloads, according to the available data) and Abstracts Views on Vision4Press platform.
Data correspond to usage on the plateform after 2015. The current usage metrics is available 48-96 hours after online publication and is updated daily on week days.
Initial download of the metrics may take a while.