Free Access
Fig. B.3
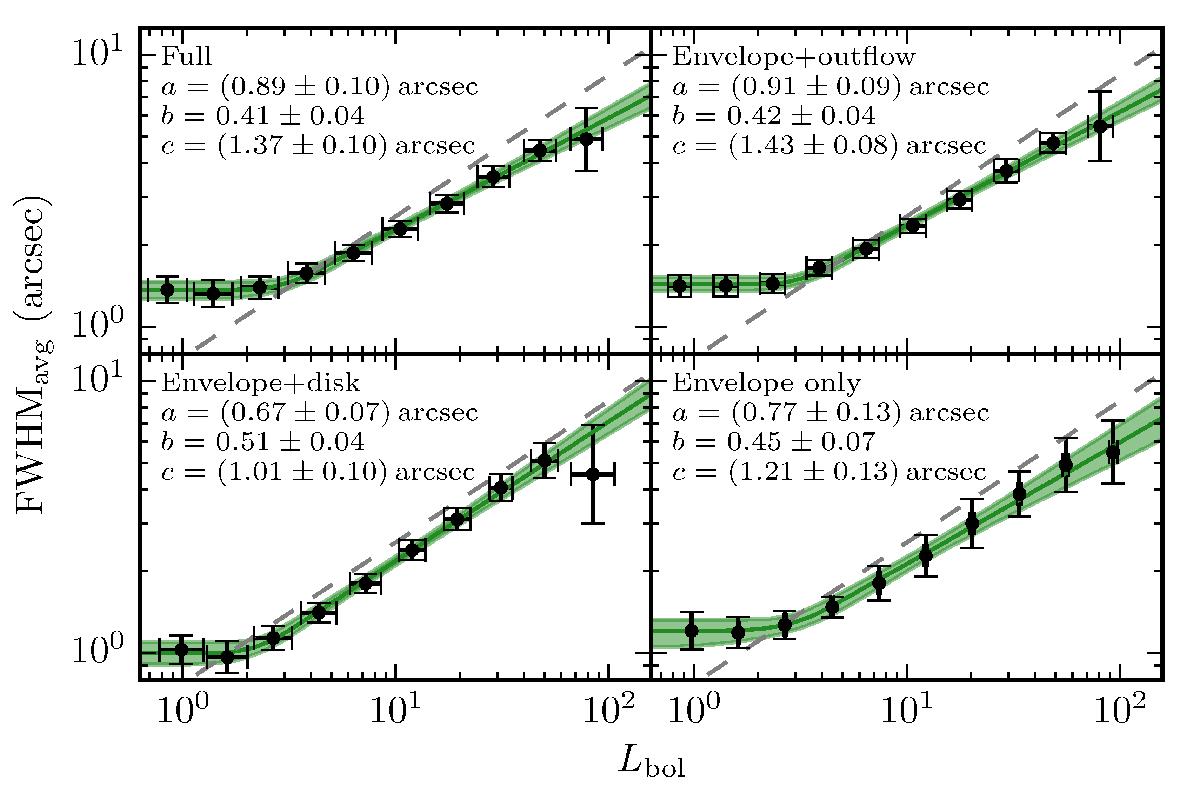
Size of the C18O-emitting region as function of the measured luminosity, Lbol, for the different sets of models. The errorbars indicate binned results, and the best fitting model, along with the 1σ uncertainty region is shown in green. Equation (B.1)is shown as the grey dashed line.
Current usage metrics show cumulative count of Article Views (full-text article views including HTML views, PDF and ePub downloads, according to the available data) and Abstracts Views on Vision4Press platform.
Data correspond to usage on the plateform after 2015. The current usage metrics is available 48-96 hours after online publication and is updated daily on week days.
Initial download of the metrics may take a while.