Fig. 1
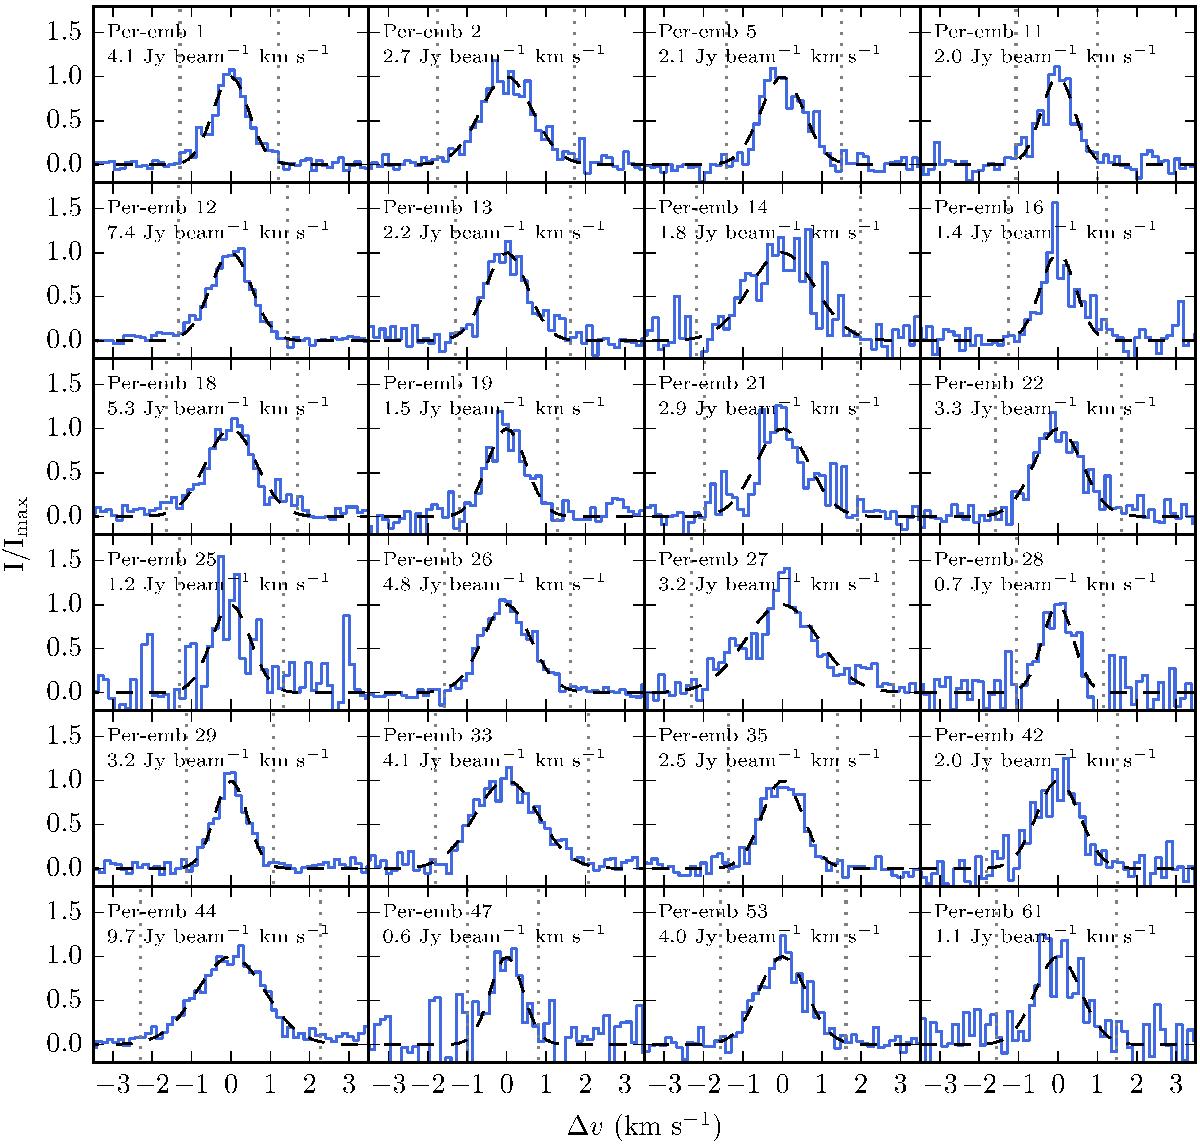
C18O 2–1 spectra towards the peak of the integrated emission of the observed sources. The integration intervals used for producing the moment-zero maps in Fig. 2 are indicated by vertical dotted lines and run from −2.5σ to 2.5σ of the fitted Gaussians (black dashed lines). The numeric value in the top left corner of each panel is the integrated emission over the line.
Current usage metrics show cumulative count of Article Views (full-text article views including HTML views, PDF and ePub downloads, according to the available data) and Abstracts Views on Vision4Press platform.
Data correspond to usage on the plateform after 2015. The current usage metrics is available 48-96 hours after online publication and is updated daily on week days.
Initial download of the metrics may take a while.