| Issue |
A&A
Volume 602, June 2017
|
|
|---|---|---|
| Article Number | A122 | |
| Number of page(s) | 7 | |
| Section | The Sun | |
| DOI | https://doi.org/10.1051/0004-6361/201629652 | |
| Published online | 26 June 2017 | |
Chains of type-I radio bursts and drifting pulsation structures
Astronomical Institute of the Czech Academy of Sciences, Fričova 258, 251 65 Ondřejov, Czech Republic
e-mail: This email address is being protected from spambots. You need JavaScript enabled to view it.
Received: 5 September 2016
Accepted: 25 April 2017
Abstract
Aims. Owing to similarities of chains of type-I radio bursts and drifting pulsation structures the question arises as to whether both these radio bursts are generated by similar processes.
Methods. Characteristics and parameters of both these radio bursts are compared.
Results. We present examples of both types of bursts and show their similarities and differences. Then, for chains of type-I bursts, a similar model as for drifting pulsation structures (DPSs) is proposed. We show that, similar to the DPS model, the chains of type-I bursts can be generated by the fragmented magnetic reconnection associated with plasmoid interactions. To support this new model of chains of type-I bursts, we present an effect of merging two plasmoids to form one larger plasmoid on the radio spectrum of DPS. This process can also explain the ‘wavy’ appearance of some chains of type-I bursts. Further, we show that the chains of type-I bursts with the wavy appearance can be used for estimation of the magnetic field strength in their sources. We think that differences of chains of type-I bursts and DPSs are mainly owing to different regimes of the magnetic field reconnection. While in the case of chains of type-I bursts, the magnetic reconnection and plasmoid interactions are in the quasi-separatrix layer of the active region in more or less quasi-saturated regime, in the case of DPSs, observed in the impulsive phase of eruptive flares, the magnetic reconnection and plasmoid interactions are in the current sheet formed under the flare magnetic rope, which moves upwards and forces this magnetic reconnection.
Key words: Sun: radio radiation / Sun: activity / Sun: flares
© ESO, 2017
1. Introduction
Solar radio bursts are generally divided into five groups designated as type-I, -II, -III, -IV and -V (Kundu 1965). Most of them show fine structures, especially type-IV bursts: fibers, zebra patterns, spikes and pulsations (Krueger 1979).
In the present paper we study two types of bursts: type-I bursts (Elgarøy 1977) and a special type of pulsation called drifting pulsation structures (DPSs; Kliem et al. 2000; Karlický et al. 2001, 2002; Karlický 2004; Nishizuka et al. 2015).
Type-I radio bursts (noise storms) are quite common phenomena observed in metric wavelength range up to about 400 MHz. They last from a few hours to several days and are associated with the active region passage over the solar disc (Elgarøy 1977; Krucker et al. 1995). They appear in clouds of short duration and narrow bandwidth bursts (0.1–3 s; several MHz), superimposed on a broadband continuum. The polarization of type-I bursts is in most cases the same as the background continuum polarization. While the polarization up to 100% is observed for the noise storms located close to the solar disc center, at the solar limb their polarization is lower (Kai et al. 1985). The type-I bursts are structured, they form chains of type-I bursts (in short type-I chains; Elgaroy & Ugland 1970). These chains preferentially drift towards lower frequencies and their drift is used for estimations of the magnetic field in their sources (Gopalswamy et al. 1986; Sarma 1994; Sodré et al. 2015). Sometimes the type-I chains even oscillate in frequencies (the “wavy” appearance on the dynamic spectrum; Elgarøy 1977).
Recently, Mercier et al. (2015) found that noise storms consist of an extended halo and several compact cores whose intensity changes over time periods of a few seconds. Regions, where storms originated were much denser than the ambient corona and their vertical extent was smaller than estimated from hydrostatic equilibrium.
Moreover, Mandrini et al. (2015) proposed that persistent magnetic reconnection along quasi-separatrix layers of the active region is responsible for the continuous metric noise storm.
Several models of type-I bursts were proposed, see the book of Elgarøy (1977) and Kai et al. (1985). Among them the most promising models are those based on the plasma emission mechanism, for example, the model by Spicer et al. (1982) connecting the type-I chains with weakly super-Alfvenic shocks generated in the front of emerging magnetic flux.
In solar flares, in the decimetric range, pulsations are relatively common (Aschwanden 1986; Krueger 1979; Isliker & Benz 1994; Jiřička et al. 2001; Nindos & Aurass 2007; Aschwanden 2004). Among them a special type of the pulsations called now drifting pulsation structures (DPSs) have been recognized and interpreted (Kliem et al. 2000; Karlický et al. 2001, 2002; Khan et al. 2002; Karlický 2004; Nishizuka et al. 2015). They are relatively narrowband and drifting mostly towards lower frequencies. Further, they are usually observed during the impulsive phase of eruptive flares in the 0.6–3 GHz frequency range in connection with the plasmoid ejection.
A nice example of the plasmoid ejection, observed in soft X-rays during the 5 October 1992 event, is described in the paper by Ohyama & Shibata (1998). It is shown that the plasmoid is a small part of the three-dimensional (3D) loop (Figs. 2, 5a, and 10 in Ohyama & Shibata 1998). Further analysis showed that the plasmoid is a small part of the 3D current-carrying loop, which is embedded in the current sheet, where the flare magnetic reconnection takes place (see Fig. 2 in Savage et al. 2012). The magnetic reconnection accelerates superthermal electrons (Drake et al. 2005, 2006; Pritchett 2006, 2008) that are then trapped in a denser O-type magnetic structure, which thus becomes “visible” as the plasmoid in the soft X-rays (Ohyama & Shibata 1998), EUV (Takasao et al. 2012) or at 17 GHz radio waves (Karlický & Kliem 2010). The limited extent of the plasmoid along the loop (i.e., trapping of superthermal electrons along the loop) can be explained by a complexity of magnetic field lines at the plasmoid as shown in the 3D kinetic simulation of the magnetic reconnection (Guo et al. 2015) or by the distribution of superthermal electrons with the high-pitch angles only. Further possibilities of this trapping are discussed in the paper by Ohyama & Shibata (1998). The plasmoid in 3D has a cylindrical form, which in its 2D models (invariant in the third coordinate) corresponds to a circular magnetic structure having a plasma density greater than that in the surrounding plasma; we refer to Bárta et al. (2008b,a) and the following Fig. 3.
The model of DPSs was developed in papers by Kliem et al. (2000), Bárta et al. (2008b, 2011), Karlický et al. (2010), Karlický & Bárta (2011). During the 5 October 1992 event the frequency of DPS was found to be close to the plasma frequency derived from the plasmoid density; we refer to Fig. 1 in the paper by Bárta et al. (2008a). Therefore in the DPS model the plasma emission mechanism is considered. In the flare current sheet, during the magnetic reconnection plasmoids are generated due to the tearing mode instability. At X-points of the magnetic reconnection, superthermal electrons are accelerated (Karlický 2008). These electrons are then trapped in a nearby plasmoid (O-type magnetic field structure), where they generate plasma waves that, after their conversion to electromagnetic waves, produce DPSs (see Fig. 9 in Karlický et al. 2010). The narrow bandwidth of DPSs is given by the limited interval of the plasma densities (plasma frequencies) inside the plasmoid. In the flare current sheet plasmoids preferentially move upwards in the solar atmosphere (due to a tension of the surrounding magnetic field lines Bárta et al. 2008b), that is, in the direction where the electron plasma density decreases; that is why DPSs mostly drift to low frequencies. The velocity of plasmoids is in the range from zero to the local Alfvén speed. The acceleration of electrons at X-points of the magnetic reconnection is quasi-periodic, which causes quasi-periodic pulsations of DPSs. The typical period of the pulses is about one second. In some cases these pulses have the frequency drift which is caused by propagation of the superthermal electrons inside the plasmoid.
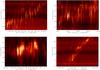 |
Fig. 1 Examples of the chains of type-I radio bursts observed in the metric range by the Callisto Trieste radiospectrograph. |
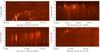 |
Fig. 2 Examples of the drifting pulsation structures (DPSs) observed in the decimetric range during solar flares by the Ondřejov radiospectrograph (Jiřička & Karlický 2008). |
In this paper, we compare chains of type-I bursts and drifting pulsation structures observed in the impulsive phase of eruptive flares. Based on this comparison we propose a new model of the chains of type-I bursts. The chains of type-I bursts are considered to be radio signatures of processes that heat the solar corona. Therefore, a correct model of type-I bursts could contribute to a solution of the problem of the hot corona.
The paper is structured as follows: in Sect. 2, we compare chains of type-I bursts and DPSs and show their similarities and differences. Then, in Sect. 3, for chains of type-I bursts, we propose a model similar to that of DPSs and then we discuss processes that could explain their differences. Conclusions are in Sect. 4.
2. Comparison of chains of type-I radio bursts and drifting pulsating structures
Examples of type-I drifting chains and drifting pulsation structures (DPSs) are shown in Figs. 1 and 2. Their typical parameters are summarized in Table 1. The parameters of the type-I chains were taken combining the results presented by Elgarøy (1977), Krueger (1979), Kai et al. (1985), Mercier et al. (2015), Sodré et al. (2015). Alternatively, the parameters of DPSs are taken from papers by Jiřička et al. (2001), Bárta et al. (2008a), Nishizuka et al. (2015). We highlight that for DPSs there is only one polarization measurement (P ~ 30%) presented in the paper by Karlický et al. (2001). The brightness temperature of DPS was calculated for the 5 October 1992 event (Ohyama & Shibata 1998; Kliem et al. 2000) assuming that the DPS source size is equal to the plasmoid size. While for type-I chains it is commonly believed that their polarization is consistent with the O-mode (Kai et al. 1985), for DPS it is unclear. Periods of repetition of type-I bursts in chains and pulsations in DPSs are similar, from fractions of a second to several seconds.
Typical parameters of the type-I chains and DPSs.
As shown in Table 1 some parameters of type-I chains and DPSs are comparable (duration and brightness temperature), while other parameters differ. However, type-I chains are observed in metric range and DPSs in decimetric range, that is, in different altitudes of the solar atmosphere with different densities, different density gradients and magnetic field strengths. Moreover, while DPSs are usually observed during the impulsive phase of eruptive flares (Nishizuka et al. 2015), type-I chains are a part of noise storms connected with the reconnection activity at the quasi-separatrix layer in the active region (Mandrini et al. 2015).
As to the appearance of the chains of type-I bursts and DPSs (Figs. 1 and 2), they appear similar. Both types of burst preferentially drift towards lower frequencies. In rare cases, both reveal a “wavy” appearance; we refer to the chain of type-I bursts observed on 2 July 2012 (Fig. 1, the upper right part) and DPS observed on 30 June 2002 (Fig. 2, the upper right part).
3. New model of type-I chains
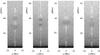 |
Fig. 3 Magnetic field lines and densities (gray shades) showing merging of two plasmoids (P1 and P2) into larger plasmoid P, which oscillates. The panels (from left to right) are shown for t = 80, 90, 100 and 110 s, respectively. |
Considering all observational parameters of both burst types and differences in the conditions during their generation we propose that the type-I chain is produced by very similar processes as DPS; they differ only in plasma parameters and initial conditions. Therefore the model of the drifting chain of type-I bursts can be explained as follows.
During the magnetic reconnection in the current sheet formed in the quasi-separatrix layer of the active region, the current-carrying loops are generated. In the magnetic reconnection between interacting current-carrying loops, there are the X-magnetic points where electrons are accelerated. These electrons penetrate into interacting loops at their interaction region. This region (plasmoid) is simultaneously rapidly heated. For the acceleration process and penetration of electrons to interacting current-carrying loops, we refer to Fig. 3 of Karlický (2008).
As seen in Figs. 2, 5a, and 10 of Ohyama & Shibata (1998), the observed plasmoid in the DPS case is a small part of the loop. We assume that a similar spatially limited plasmoid is also formed in the case of the drifting chain of type-I bursts. The limited extent of the plasmoid means that the hot plasma (observed in soft X-rays in the DPS case) is trapped by some processes in this plasmoid also in the direction along its axis. Some processes explaining this trapping were proposed in the paper by Ohyama & Shibata (1998). But based on the papers by Guo et al. (2015) and Fujimoto (2016) we think that this trapping is mainly due to complexity of magnetic field lines in the plasmoid. Considering the observational evidence about the hot plasma confinement in the plasmoid, we assume that also superthermal electrons (accelerated during the interaction of the current-carrying loops) are trapped in the plasmoid (we note that in the direction perpendicular to the plasmoid axis, the hot plasma as well as superthermal electrons are kept by the magnetic field in the plasmoid).
These trapped superthermal electrons generate the Langmuir (electrostatic) waves in the plasmoid, which are then transformed into the electromagnetic (radio) waves, observed as type-I chains. These processes are shown in detail in the paper by Karlický et al. (2010). There, using a 2.5D particle-in-cell model, we self-consistently described not only the interaction of plasmoids, but also how the electrostatic (Langmuir) and electromagnetic (radio) waves are generated. We found that the distribution of superthermal electrons penetrating the plasmoid is unstable for the Langmuir waves (due to the bump-on-tail instability) and that these electrostatic waves are then transformed to the electromagnetic (radio) waves (Fig. 9 of this paper). In agreement with the models of type-I bursts based on the plasma wave theories (Elgarøy 1977), we assume that the emission of type-I bursts is dominant on the fundamental frequency and that the processes (e.g., the coalescence of two Langmuir waves) giving the emission on the harmonic frequency are not effective. The observed polarization of type-I bursts is up to 100 percent. To reach such high polarization, in agreement with Takakura (1963) and (Melrose 1980, page 271), we assume that the type-I burst emission is in O-mode generated in the region where the emission frequency ω is greater than the plasma frequency ωpe and smaller than the cutoff frequency for the X-mode ωx. This O-mode (electromagnetic one) is generated from Langmuir waves by scattering on thermal ions and in such a case the frequency of the resulting emission is essentially equal to that of Langmuir waves (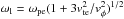 , where vte is the thermal plasma velocity and vφ is the phase velocity). Now using the commonly accepted assumption that in the type-I burst source the electron gyro-frequency ωce is much smaller that the plasma frequency, we have ωx ≈ ωpe + 1 / 2ωce. Then, the above mentioned condition ω ≅ ωl ≤ ωx gives a lower limit for the phase velocities of generated Langmuir waves, expressed as vφ ≥ vte(3ωpe/ωce)1 / 2. Because the Langmuir waves with the phase velocity vφ are produced by electrons having velocities greater than vφ, it also gives a lower limit for energies of energetic electrons.
Due to a limited interval of densities inside the plasmoid, the trapped superthermal electrons generate Langmuir waves in the limited interval of plasma frequencies and thus the instantaneous bandwidth of type-I chain is limited. Because the plasmoid expands or moves upwards in the solar atmosphere, plasma densities inside the plasmoid decrease, and therefore most type-I chains drift towards lower frequencies. Similarly to DPSs, the acceleration of superthermal electrons is quasi-periodic, which leads to quasi-periodic repetition of type-I bursts (which form the type-I chain) with a typical period of about one second. If accelerated electrons are trapped in several plasmoids simultaneously then several type-I chains are simultaneously generated. Thus, type-I chains can be mutually superimposed in the radio spectrum (if there are similar densities in the plasmoids) or they are separated in frequencies in the radio spectrum, if densities inside plasmoids are different.
As already mentioned, in some cases of type-I chains and DPSs there is also similarity in their wavy appearance. Up to now, this feature was not explained in any model of type-I chains.
In the DPS model, during the flare magnetic reconnection below the rising magnetic rope, plasmoids are formed due to the tearing mode instability (Kliem et al. 2000; Karlický 2014). The plasmoids can merge to larger plasmoids, which, after this merging (coalescence) process, start to oscillate with the period P ~ L/vA, where L is the characteristic length in the merging process and vA is the local Alfvén speed (Tajima et al. 1987). Oscillations of the plasmoid (compression and expansion) periodically change densities inside the plasmoid and thus periodically change the plasma frequencies and frequencies of DPS. This was the only process proposed to explain the quasi-periodic variations of frequencies (wavy appearance) of DPSs (Karlický et al. 2016). Here the same process is proposed for explanation of the wavy appearance of type-I chains.
To illustrate how the wavy appearance of type-I chains is produced, we made a similar numerical simulation as in the paper by Bárta et al. (2008b). The result of this simulation is shown in Fig. 3, where two plasmoids (P1 and P2) merge into one larger plasmoid P. After merging, the resulting plasmoid starts to oscillate. Figure 4 shows the time evolution of this merging and oscillating process expressed by positions of the selected magnetic field lines (with fixed magnetic vector potential) at the top and bottom of the plasmoids at the axis of the vertical and gravitationally stratified current sheet (x = 0 in Fig. 3). In our case the period of the oscillation is about 22 s. From computations we know the maximal and minimal densities inside plasmoids (which are delimited by the selected magnetic field lines) and then, assuming the emission based on the plasma emission mechanism, we computed the artificial radio spectrum shown in Fig. 5. The vertical lines in this DPS spectrum mimic pulses with a typical period of about one second. Namely, the pulses are generated on the kinetic level of the plasma description and thus their generation cannot be included in the used magnetohydrodynamic simulation.
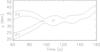 |
Fig. 4 Merging process of two plasmoids (P1 and P2), along the axis of the vertical and gravitationally stratified current sheet, giving rise to one larger and oscillating plasmoid P; we refer to Fig. 3 for comparison. |
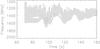 |
Fig. 5 Artificial radio spectrum of DPS with the wavy appearance corresponding to the merging process of two plasmoids into one larger and oscillating plasmoid as presented in Figs. 3 and 4. Vertical lines mimic pulses in DPS with the typical period of DPS (about 1 s). |
As seen in Fig. 5, the artificial drifting pulsation structure has a “wavy” appearance. When the oscillating plasmoid is compressed, the frequency band of the drifting pulsation structure is shifted to higher frequencies and vice versa. We compare this artificial drifting pulsation structure with that observed on 30 June 2002, shown in Fig. 2 (the upper right part). For details of computations, we refer to Bárta et al. (2008b).
We take the fact that type-I chains and DPSs with the wavy appearance are relatively rare as an indicator that the full merging of two plasmoids with comparable sizes into one larger and oscillating plasmoid is also relatively rare.
In previous models the frequency drift of type-I chains was connected with the Alfvén speed at the source of the type-I chain, for example, in the model by Spicer et al. (1982) and thus used for the magnetic field estimations (Sodré et al. 2015). However, in the new model, the speed of the plasmoid can be in the range from zero up to the local Alfvén speed, see Bárta et al. (2008b).
Type-I chains are limited from the high-frequency side at about 400 MHz. It is commonly believed that it is due to that the emission optical depth increases with the emission frequency to the square (Benz 1993). On the other hand, the range of type-I chains (below ~400 MHz) shows that these chains are generated at upper parts of the active-region loops located close to the quasi-separatrix layers of the active region as proposed by Mandrini et al. (2015).
DPSs are observed on higher frequencies than type-I chains, at which, in the “quiet” conditions of the solar atmosphere, the plasma emission is fully absorbed. However, during solar flares the atmosphere becomes highly inhomogeneous and thus transparent for the plasma emission even in the decimetric range.
If the size of the resulting plasmoid (L), formed during a merging process, is estimated (e.g., from the instantaneous frequency bandwidth of the chain and some density model of the solar atmosphere), then the period (PW) of the chains with the wavy appearance can be used for further estimation of the magnetic field strength B in the chain radio source (the Alfvén speed is 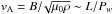 , where μ0 is the magnetic permeability of free space and ρ is the plasma density, that can be determined from the frequency of the chain, see also Tajima et al. 1987).
There is an important difference in processes generating type-I chains and DPSs. While, in DPSs, the magnetic reconnection is forced by the positive feedback between the magnetic reconnection and plasma inflow given by the ejection of the whole flare structure upwards, in the processes generating type-I chains, this positive feedback in the magnetic reconnection is missing.
These two regimes (with and without the positive feedback) of the magnetic reconnection together with plasmoids generating type-I chains and drifting pulsation structures can be seen, for example, in the 12 July 2012 flare (Dudík et al. 2014). Chains of type-I bursts (noise storm) were observed before the flare (at 15:00–16:16 UT) and then during the flare impulsive phase (at 16:16 UT), when the flare magnetic rope was ejected, the drifting pulsation structures were observed.
4. Conclusions
As shown in the previous section, some parameters of type-I chains and DPSs are similar (duration, repetition period of type-I bursts in the type-I chain and that of pulses in DPS, preference of the frequency drift towards lower frequencies, brightness temperature and wavy appearance in some cases) and other parameters, such as frequency range, bandwidth, frequency drift, source size and polarization, are different. However, the differences can be caused by different conditions where type-I chains and DPSs are generated (different altitude in the solar atmosphere, different densities, different density gradients and different magnetic field strengths).
Therefore, considering all these similarities and differences, we propose a new model of chains of type-I bursts that is very similar to the DPS model. Although the magnetic reconnection was already proposed as an explanation of noise storms (Mandrini et al. 2015), this new model is more specific about the processes generating the chains of type-I bursts, which are a part of noise storms. The chains of type-I bursts are considered to be radio signatures of processes that heat the solar corona. Therefore, a correct model of these processes could contribute to a solution of the problem of the hot solar corona.
We show that the chains of type-I bursts can be generated by the magnetic reconnection associated with plasmoids (parts of current-carrying loops). While a trapping of accelerated superthermal electrons in a single plasmoid leads to normal type-I chains (without the wavy appearance), the trapping of superthermal electrons in an oscillating plasmoid, which can be the result of merging of two smaller plasmoids, produces the type-I chain with the wavy appearance.
Similarly to DPSs, individual type-I bursts (forming the type-I chain) are generated by quasi-periodic acceleration of superthermal electrons and their plasma emission. The frequency drift of these individual type-I bursts can be caused by propagation of these superthermal electrons inside the plasmoid.
We think that differences between these two types of burst are also owing to different regimes of the magnetic reconnection. While in the case of type-I chains, the magnetic reconnection and plasmoid interactions are in the quasi-separatrix layers of the active region in more or less quasi-saturated regime, in the case of DPSs, the magnetic reconnection and plasmoids formation and their interactions are forced by the upward motion of the flare magnetic rope.
The new model can explain the “wavy” appearance of some chains of type-I bursts by the merging of two plasmoids into one larger, oscillating one. Until now, this feature had not been explained.
We show that the chains of type-I bursts with the wavy appearance can be used for estimation of the magnetic field strength in their sources. Unfortunately, examples of the chains of type-I bursts with the wavy appearance are rare.
DPSs are generated in deeper and denser layers of the solar atmosphere than chains of type-I bursts. In the “quiet” coronal conditions, the plasma radio emission from these deep and dense layers is absorbed. However, during the impulsive phase of solar flares these deep and dense layers are strongly disturbed and thus they become transparent also for the DPS emission.
This new model can also explain the finding that the vertical extent of the noise storm is smaller than estimated from hydrostatic equilibrium (Mercier et al. 2015). Namely, complicated magnetic field structure in the region with plasmoids can shorten the density scale-height similarly as was proposed for microwave type-III pair bursts by Tan et al. (2016a,b). Furthermore, this model explains an enhanced density in the noise storm source compared to the ambient corona (Mercier et al. 2015). As was shown, the plasmoids, where the type-I chains are generated, are denser than the surrounding plasma.
In this new model the plasmoid velocity, which is assumed to be connected with the frequency drift of the type-I chain, is in the range from zero to the local Alfvén speed; contrary to previous models, where the velocity of the agent producing the frequency drift was strictly the Alfvén speed. This should be taken into consideration when the frequency drift of type-I chains is used for magnetic field estimations.
Many questions remain, especially with regards to the plasmoid formation, its magnetic structure and evolution of the superthermal electrons in real 3D configuration. For answers to these questions, new simulations in extended 3D kinetic models are necessary.
Acknowledgments
The author thanks the referee for constructive comments that improved the paper. He acknowledges support from Grants 16-13277S and 17-16447S of the Grant Agency of the Czech Republic.
References
- Aschwanden, M. J. 1986, Sol. Phys., 104, 57 [NASA ADS] [CrossRef] [Google Scholar]
- Aschwanden, M. J. 2004, Physics of the Solar Corona, An Introduction (UK: Praxis Publishing Ltd) [Google Scholar]
- Bárta, M., Karlický, M., & Žemlička, R. 2008a, Sol. Phys., 253, 173 [NASA ADS] [CrossRef] [Google Scholar]
- Bárta, M., Vršnak, B., & Karlický, M. 2008b, A&A, 477, 649 [NASA ADS] [CrossRef] [EDP Sciences] [Google Scholar]
- Bárta, M., Büchner, J., Karlický, M., & Skála, J. 2011, ApJ, 737, 24 [NASA ADS] [CrossRef] [Google Scholar]
- Benz, A. O., ed. 1993, Plasma astrophysics: Kinetic processes in solar and stellar coronae, Astrophys. Space Sci. Lib., 184 [Google Scholar]
- Drake, J. F., Shay, M. A., Thongthai, W., & Swisdak, M. 2005, Phys. Rev. Lett., 94, 095001 [NASA ADS] [CrossRef] [PubMed] [Google Scholar]
- Drake, J. F., Swisdak, M., Che, H., & Shay, M. A. 2006, Nature, 443, 553 [NASA ADS] [CrossRef] [PubMed] [Google Scholar]
- Dudík, J., Janvier, M., Aulanier, G., et al. 2014, ApJ, 784, 144 [NASA ADS] [CrossRef] [Google Scholar]
- Elgarøy, E. Ø. 1977, Solar noise storms (UK: Pergamon Press, Oxford) [Google Scholar]
- Elgaroy, O., & Ugland, O. 1970, A&A, 5, 372 [NASA ADS] [Google Scholar]
- Fujimoto, K. 2016, Geophys. Res. Lett., 43, 10 [CrossRef] [Google Scholar]
- Gopalswamy, N., Thejappa, G., Sastry, C. V., & Tlamicha, A. 1986, Bulletin of the Astronomical Institutes of Czechoslovakia, 37, 115 [NASA ADS] [Google Scholar]
- Guo, F., Liu, Y.-H., Daughton, W., & Li, H. 2015, ApJ, 806, 167 [NASA ADS] [CrossRef] [Google Scholar]
- Isliker, H., & Benz, A. O. 1994, A&AS, 104 [Google Scholar]
- Jiřička, K., & Karlický, M. 2008, Sol. Phys., 253, 95 [NASA ADS] [CrossRef] [Google Scholar]
- Jiřička, K., Karlický, M., Mészárosová, H., & Snížek, V. 2001, A&A, 375, 243 [NASA ADS] [CrossRef] [EDP Sciences] [Google Scholar]
- Kai, K., Melrose, D. B., & Suzuki, S. 1985, in Solar Radiophysics: Studies of Emission from the Sun at metre wavelengths, eds. D. J. McLean, & N. R. Labrum (Cambridge University Press), 415 [Google Scholar]
- Karlický, M. 2004, A&A, 417, 325 [NASA ADS] [CrossRef] [EDP Sciences] [Google Scholar]
- Karlický, M. 2008, ApJ, 674, 1211 [NASA ADS] [CrossRef] [Google Scholar]
- Karlický, M. 2014, Res. Astron. Astrophys., 14, 753 [NASA ADS] [CrossRef] [Google Scholar]
- Karlický, M., & Bárta, M. 2011, ApJ, 733, 107 [NASA ADS] [CrossRef] [Google Scholar]
- Karlický, M., & Kliem, B. 2010, Sol. Phys., 266, 71 [NASA ADS] [CrossRef] [Google Scholar]
- Karlický, M., Yan, Y., Fu, Q., et al. 2001, A&A, 369, 1104 [NASA ADS] [CrossRef] [EDP Sciences] [Google Scholar]
- Karlický, M., Fárník, F., & Mészárosová, H. 2002, A&A, 395, 677 [NASA ADS] [CrossRef] [EDP Sciences] [Google Scholar]
- Karlický, M., Bárta, M., & Rybák, J. 2010, A&A, 514, A28 [NASA ADS] [CrossRef] [EDP Sciences] [Google Scholar]
- Karlický, M., Jiřička, K., & Bárta, M. 2016, Central European Astrophysical Bulletin, 40, 93 [NASA ADS] [Google Scholar]
- Khan, J. I., Vilmer, N., Saint-Hilaire, P., & Benz, A. O. 2002, A&A, 388, 363 [NASA ADS] [CrossRef] [EDP Sciences] [Google Scholar]
- Kliem, B., Karlický, M., & Benz, A. O. 2000, A&A, 360, 715 [NASA ADS] [Google Scholar]
- Krucker, S., Benz, A. O., Aschwanden, M. J., & Bastian, T. S. 1995, Sol. Phys., 160, 151 [NASA ADS] [CrossRef] [Google Scholar]
- Krueger, A. 1979, Geophysics and Astrophysics Monographs, 16, 23 [NASA ADS] [Google Scholar]
- Kundu, M. R. 1965, Solar radio astronomy (New York: Interscience Publ.) [Google Scholar]
- Mandrini, C. H., Baker, D., Démoulin, P., et al. 2015, ApJ, 809, 73 [NASA ADS] [CrossRef] [Google Scholar]
- Melrose, D. B. 1980, Plasma astrophysics: Nonthermal processes in diffuse magnetized plasmas, Volume 2 – Astrophysical applications (New York: Gordon and Breach Science Publ.) [Google Scholar]
- Mercier, C., Subramanian, P., Chambe, G., & Janardhan, P. 2015, A&A, 576, A136 [NASA ADS] [CrossRef] [EDP Sciences] [Google Scholar]
- Nindos, A., & Aurass, H. 2007, in Lect. Not. Phys., 725, eds. K.-L. Klein, & A. L. MacKinnon (Berlin Springer Verlag), 251 [Google Scholar]
- Nishizuka, N., Karlický, M., Janvier, M., & Bárta, M. 2015, ApJ, 799, 126 [NASA ADS] [CrossRef] [Google Scholar]
- Ohyama, M., & Shibata, K. 1998, ApJ, 499, 934 [NASA ADS] [CrossRef] [Google Scholar]
- Pritchett, P. L. 2006, J. Geophys. Res.: Space Phys., 111, A10212 [Google Scholar]
- Pritchett, P. L. 2008, Phys. Plasmas, 15, 102105 [NASA ADS] [CrossRef] [Google Scholar]
- Sarma, S. B. S. S. 1994, Austr. J. Phys., 47, 811 [NASA ADS] [CrossRef] [Google Scholar]
- Savage, S. L., Holman, G., Reeves, K. K., et al. 2012, ApJ, 754, 13 [Google Scholar]
- Sodré, Z. A. L., Cunha-Silva, R. D., & Fernandes, F. C. R. 2015, Sol. Phys., 290, 159 [NASA ADS] [CrossRef] [Google Scholar]
- Spicer, D. S., Benz, A. O., & Huba, J. D. 1982, A&A, 105, 221 [NASA ADS] [Google Scholar]
- Tajima, T., Sakai, J., Nakajima, H., et al. 1987, ApJ, 321, 1031 [NASA ADS] [CrossRef] [Google Scholar]
- Takakura, T. 1963, PASJ, 15, 462 [NASA ADS] [Google Scholar]
- Takasao, S., Asai, A., Isobe, H., & Shibata, K. 2012, ApJ, 745, L6 [NASA ADS] [CrossRef] [Google Scholar]
- Tan, B., Mészárosová, H., Karlický, M., Huang, G., & Tan, C. 2016a, ApJ, 819, 42 [NASA ADS] [CrossRef] [Google Scholar]
- Tan, B.-L., Karlický, M., Mészárosová, H., & Huang, G.-L. 2016b, Res. Astron. Astrophys., 16, 013 [NASA ADS] [CrossRef] [Google Scholar]
All Tables
All Figures
|
Fig. 1 Examples of the chains of type-I radio bursts observed in the metric range by the Callisto Trieste radiospectrograph. |
| In the text | |
|
Fig. 2 Examples of the drifting pulsation structures (DPSs) observed in the decimetric range during solar flares by the Ondřejov radiospectrograph (Jiřička & Karlický 2008). |
| In the text | |
|
Fig. 3 Magnetic field lines and densities (gray shades) showing merging of two plasmoids (P1 and P2) into larger plasmoid P, which oscillates. The panels (from left to right) are shown for t = 80, 90, 100 and 110 s, respectively. |
| In the text | |
|
Fig. 4 Merging process of two plasmoids (P1 and P2), along the axis of the vertical and gravitationally stratified current sheet, giving rise to one larger and oscillating plasmoid P; we refer to Fig. 3 for comparison. |
| In the text | |
|
Fig. 5 Artificial radio spectrum of DPS with the wavy appearance corresponding to the merging process of two plasmoids into one larger and oscillating plasmoid as presented in Figs. 3 and 4. Vertical lines mimic pulses in DPS with the typical period of DPS (about 1 s). |
| In the text | |
Current usage metrics show cumulative count of Article Views (full-text article views including HTML views, PDF and ePub downloads, according to the available data) and Abstracts Views on Vision4Press platform.
Data correspond to usage on the plateform after 2015. The current usage metrics is available 48-96 hours after online publication and is updated daily on week days.
Initial download of the metrics may take a while.