Free Access
Fig. 3
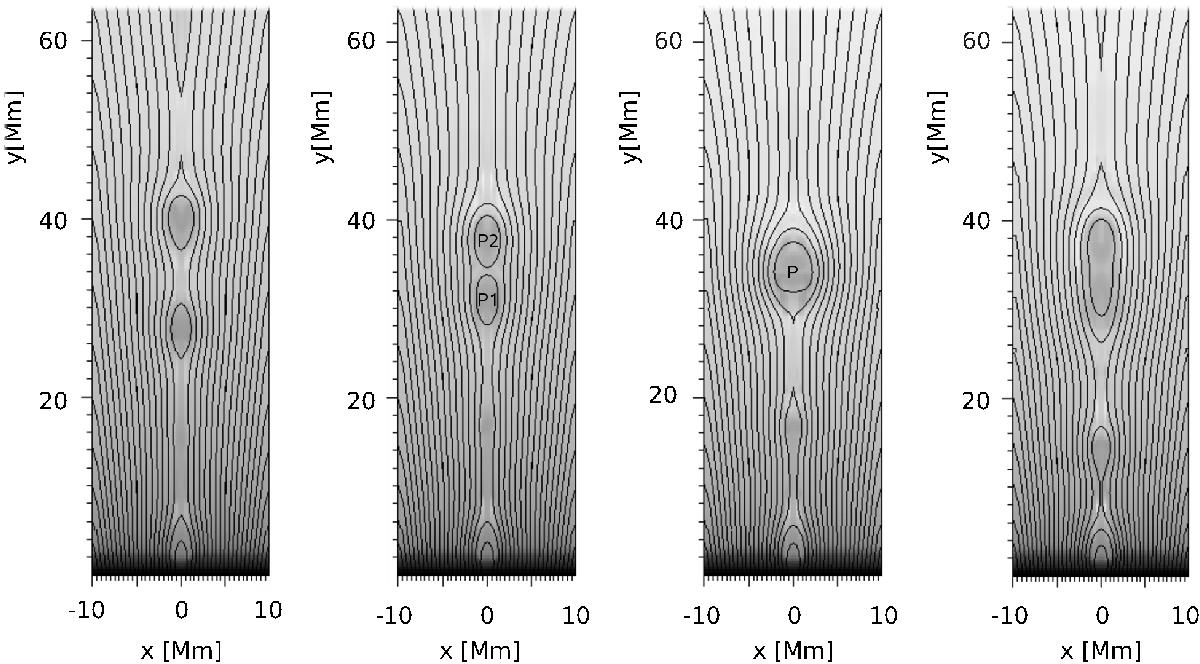
Magnetic field lines and densities (gray shades) showing merging of two plasmoids (P1 and P2) into larger plasmoid P, which oscillates. The panels (from left to right) are shown for t = 80, 90, 100 and 110 s, respectively.
Current usage metrics show cumulative count of Article Views (full-text article views including HTML views, PDF and ePub downloads, according to the available data) and Abstracts Views on Vision4Press platform.
Data correspond to usage on the plateform after 2015. The current usage metrics is available 48-96 hours after online publication and is updated daily on week days.
Initial download of the metrics may take a while.