Fig. 6
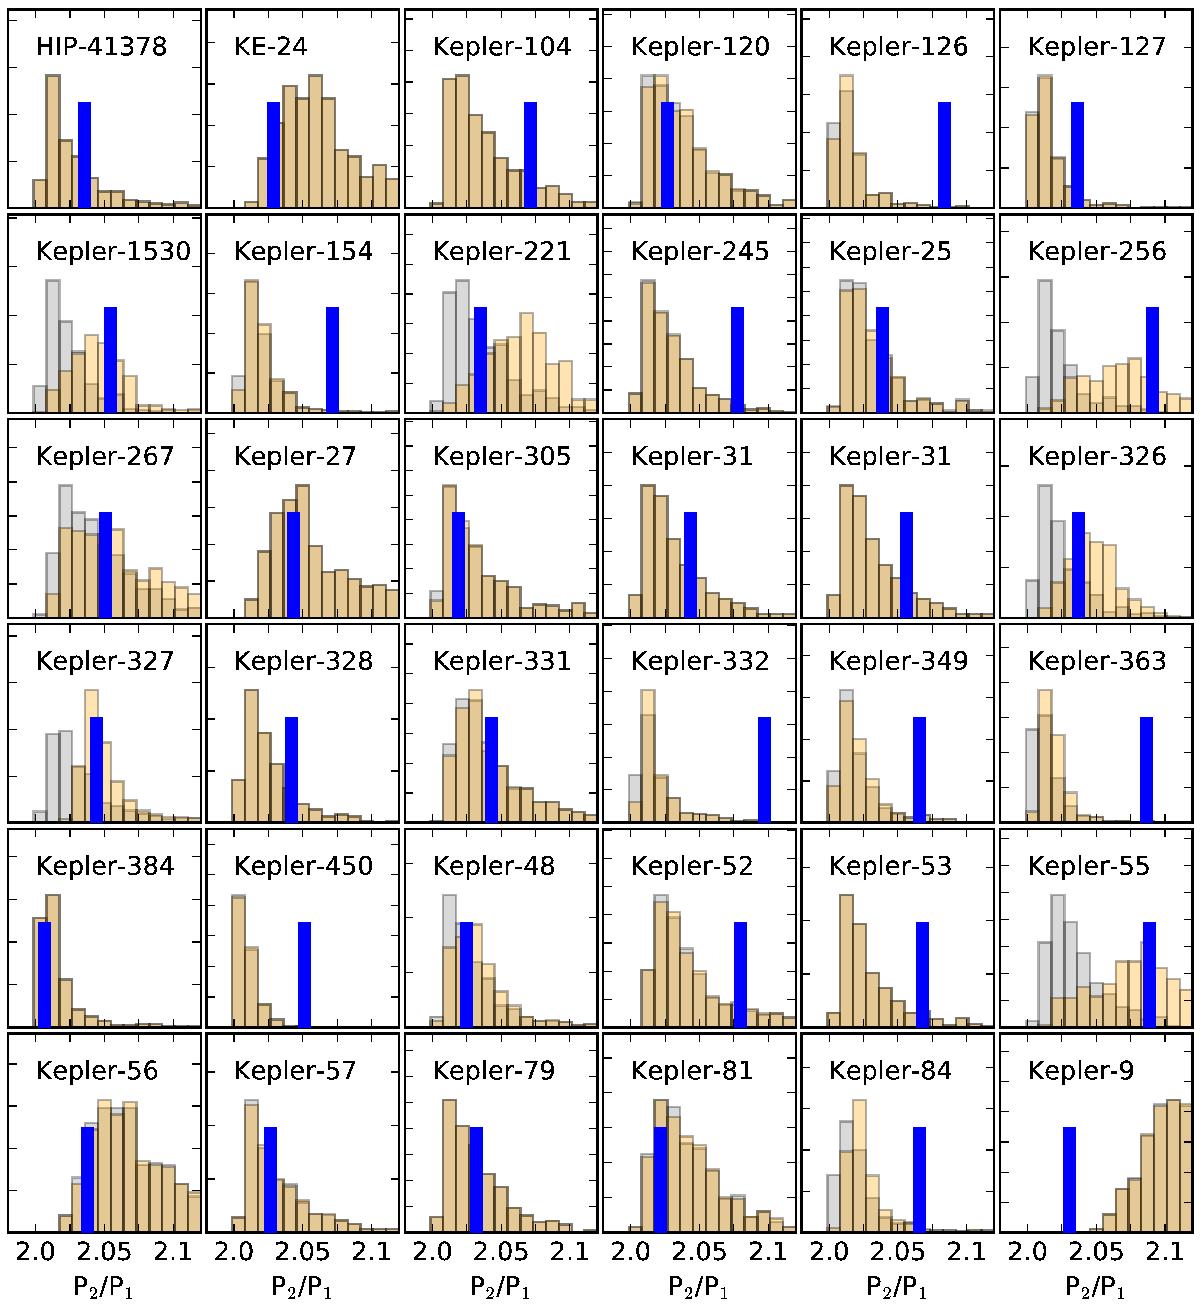
Blue columns: observed orbital period ratio P2/P1 for 36 exoplanetary pairs in the vicinity of the 2:1 resonance. Gray histograms result of 400 Monte Carlo simulations as obtained from Eq. (3) with random assigned values for masses and disk parameters (see text for details). Orange histograms previous values evolved through tidal effects for the duration of the lifespans of the systems.
Current usage metrics show cumulative count of Article Views (full-text article views including HTML views, PDF and ePub downloads, according to the available data) and Abstracts Views on Vision4Press platform.
Data correspond to usage on the plateform after 2015. The current usage metrics is available 48-96 hours after online publication and is updated daily on week days.
Initial download of the metrics may take a while.