Fig. 5

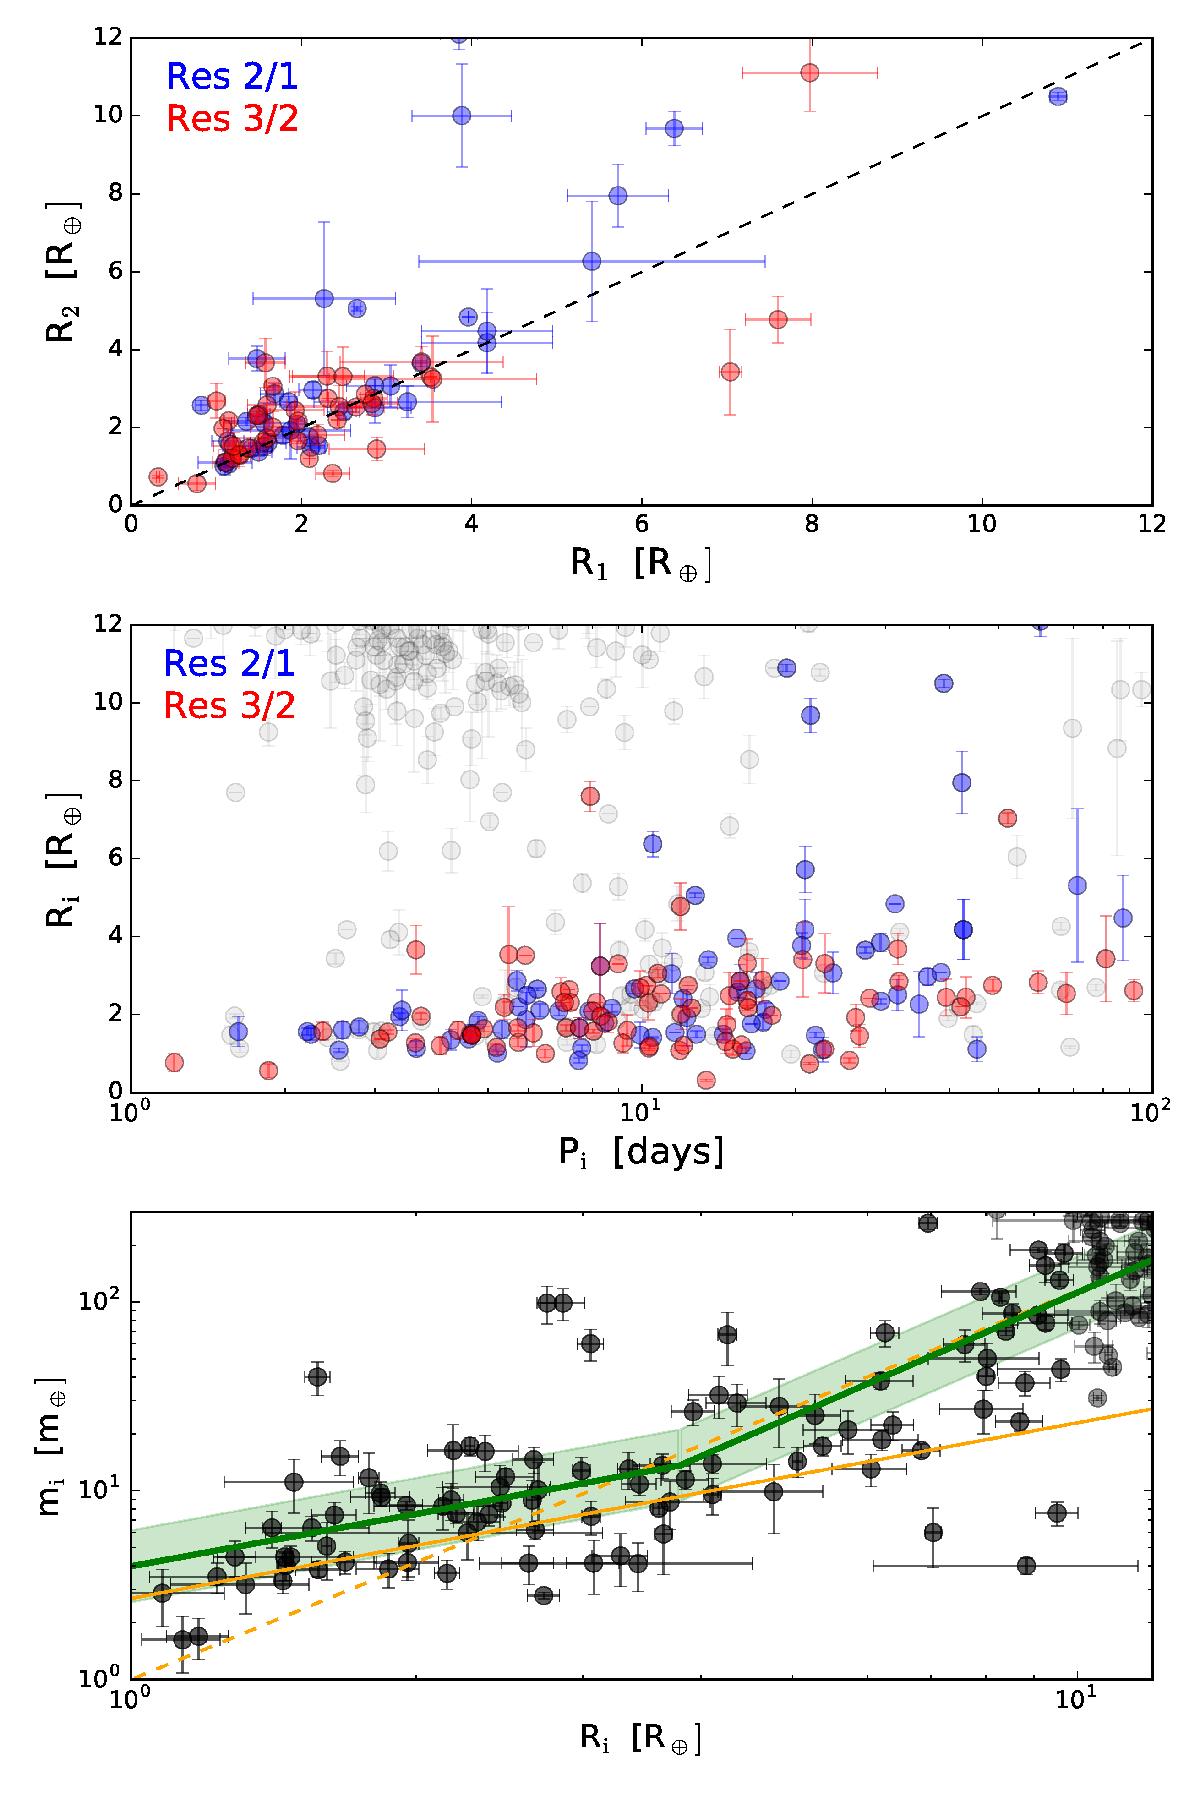
Top: distribution of radii between confirmed planets in the vicinity of the 2:1 (blue) and 3:2 (red) MMR. Dashed line corresponds to equal-size bodies (R1 = R2). Middle: radius as a function of the orbital period. Light gray circles indicate the values of planets outside both resonances. Bottom: planetary mass mi vs. radius Ri for all planets (bodies larger than Jupiter shown in gray). Dashed orange line corresponds to the so-called R2.06-law by Lissauer et al. (2011), while the fit proposed by Weiss & Marcy (2014) is shown as a continuous orange line. Our own fit, which is calculated for all planets smaller than Jupiter, is presented as a thick green line. Values within 1σdis dispersion are contained within the light green region.
Current usage metrics show cumulative count of Article Views (full-text article views including HTML views, PDF and ePub downloads, according to the available data) and Abstracts Views on Vision4Press platform.
Data correspond to usage on the plateform after 2015. The current usage metrics is available 48-96 hours after online publication and is updated daily on week days.
Initial download of the metrics may take a while.


