Fig. 4
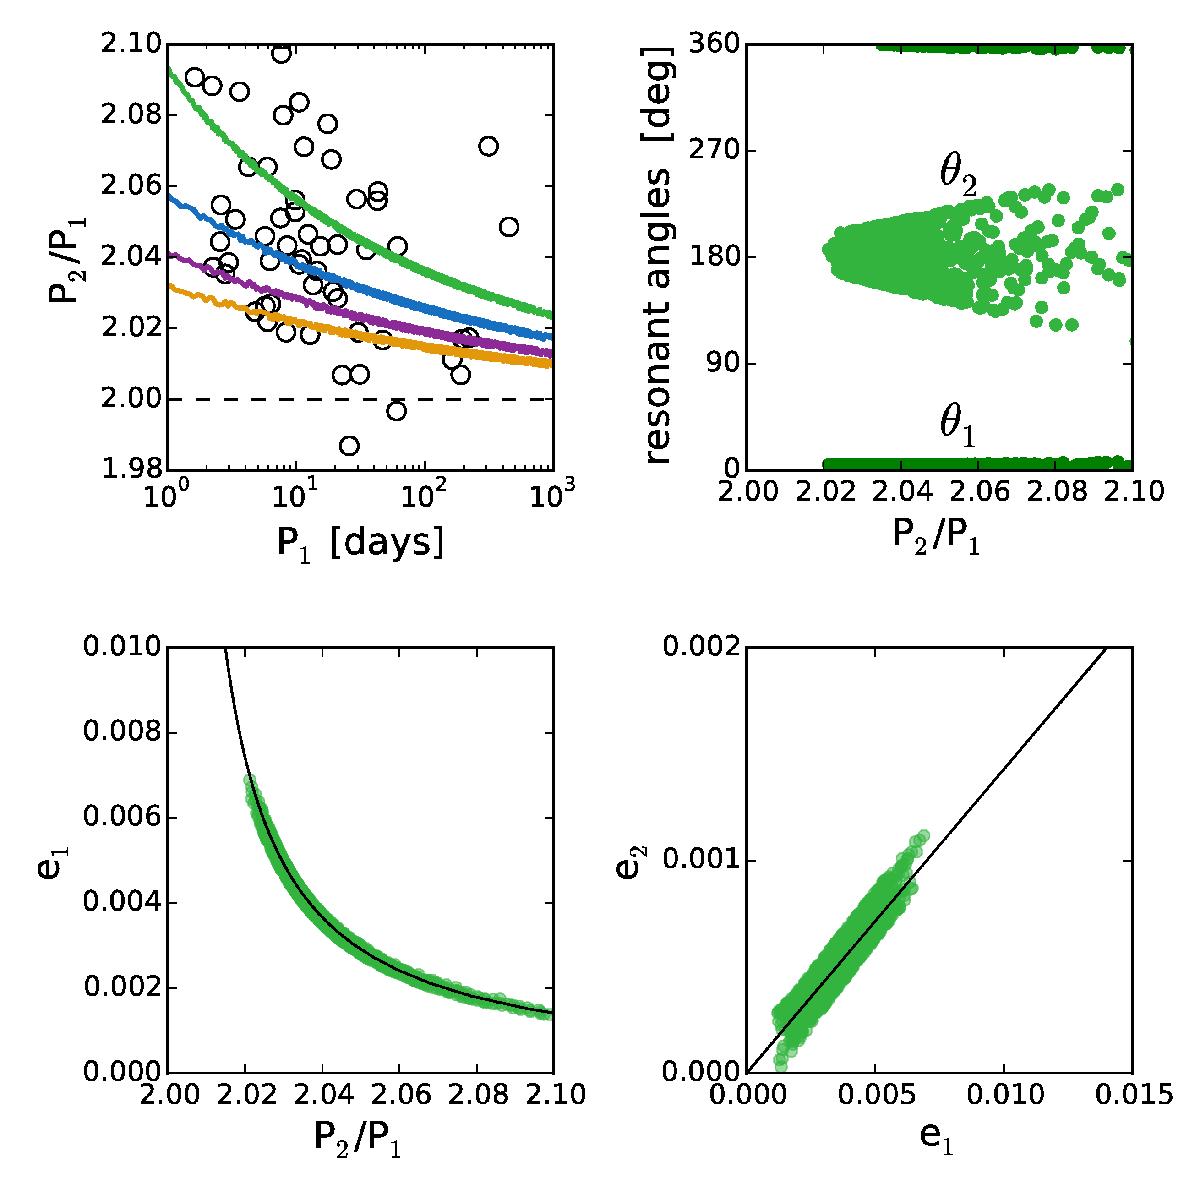
Top left panel: result of four N-body simulations leading to capture in the 2:1 MMR. In all cases m1 = 20m⊕. Color lines indicate different mass ratios: m2/m1 = 2 (orange), m2/m1 = 1.8 (purple), m2/m1 = 1.7 (blue), and m2/m1 = 1.6 (green). Remaining panels: different dynamical characteristics of the orbital evolution within the resonance of the run with m2/m1 = 1.6. The black continuous lines in the bottom panels represent the analytical predictions given by expressions (3).
Current usage metrics show cumulative count of Article Views (full-text article views including HTML views, PDF and ePub downloads, according to the available data) and Abstracts Views on Vision4Press platform.
Data correspond to usage on the plateform after 2015. The current usage metrics is available 48-96 hours after online publication and is updated daily on week days.
Initial download of the metrics may take a while.