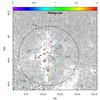
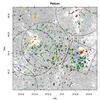
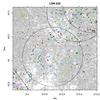
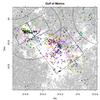
Fig. 20

Comparison between spatial distributions of X-ray sources, YSOs and other young stars in each X-ray FOV. The background grayscale image is a 2D histogram of the combined optical-NIR object density, showing clearly high-obscuration regions. Solid black circles and squares are XMM and ACIS FOVs, respectively. Symbols as in Figs. 9 and 10, except that here X-ray sources (crosses) are color-coded according to their J−H color (with the color scale show in the top left panel). X-ray sources without a NIR counterpart are shown in red. Black plus signs indicate positions of all RGS11 YSOs, regardless of their identification with X-ray or other cataloged objects. Small empty circles are young stars from Armond et al. (2011; black) and Welin (1973; violet). Yellow circles are 2MASS star clusters from Cambrésy et al. (2002). The black dashed rectangular regions are defined here as places with a local overdensity of X-ray sources, not matched by an overdensity of YSOs. The three bigger star symbols indicate respectively the O5 star 2MASS J20555125+4352246 (cyan), and FUOrs HBC722 (green) and V1057 Cyg (orange).
Current usage metrics show cumulative count of Article Views (full-text article views including HTML views, PDF and ePub downloads, according to the available data) and Abstracts Views on Vision4Press platform.
Data correspond to usage on the plateform after 2015. The current usage metrics is available 48-96 hours after online publication and is updated daily on week days.
Initial download of the metrics may take a while.