Fig. 8
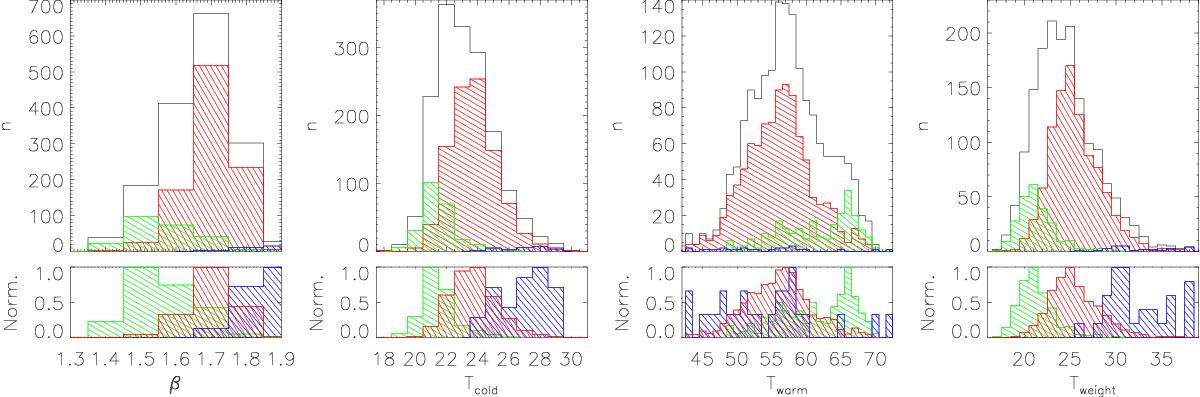
From left to right: distributions of the emissivity index (β), the temperatures of the cold (Tcold) and warm (Twarm) dust components, and the luminosity-weighted dust temperature (Tweight). In all panels, the distribution of the full sample is shown in black, SB galaxies in blue, MS galaxies in red, and PAS galaxies in green. The lower panels show the equivalent normalized histograms.
Current usage metrics show cumulative count of Article Views (full-text article views including HTML views, PDF and ePub downloads, according to the available data) and Abstracts Views on Vision4Press platform.
Data correspond to usage on the plateform after 2015. The current usage metrics is available 48-96 hours after online publication and is updated daily on week days.
Initial download of the metrics may take a while.