Fig. 7
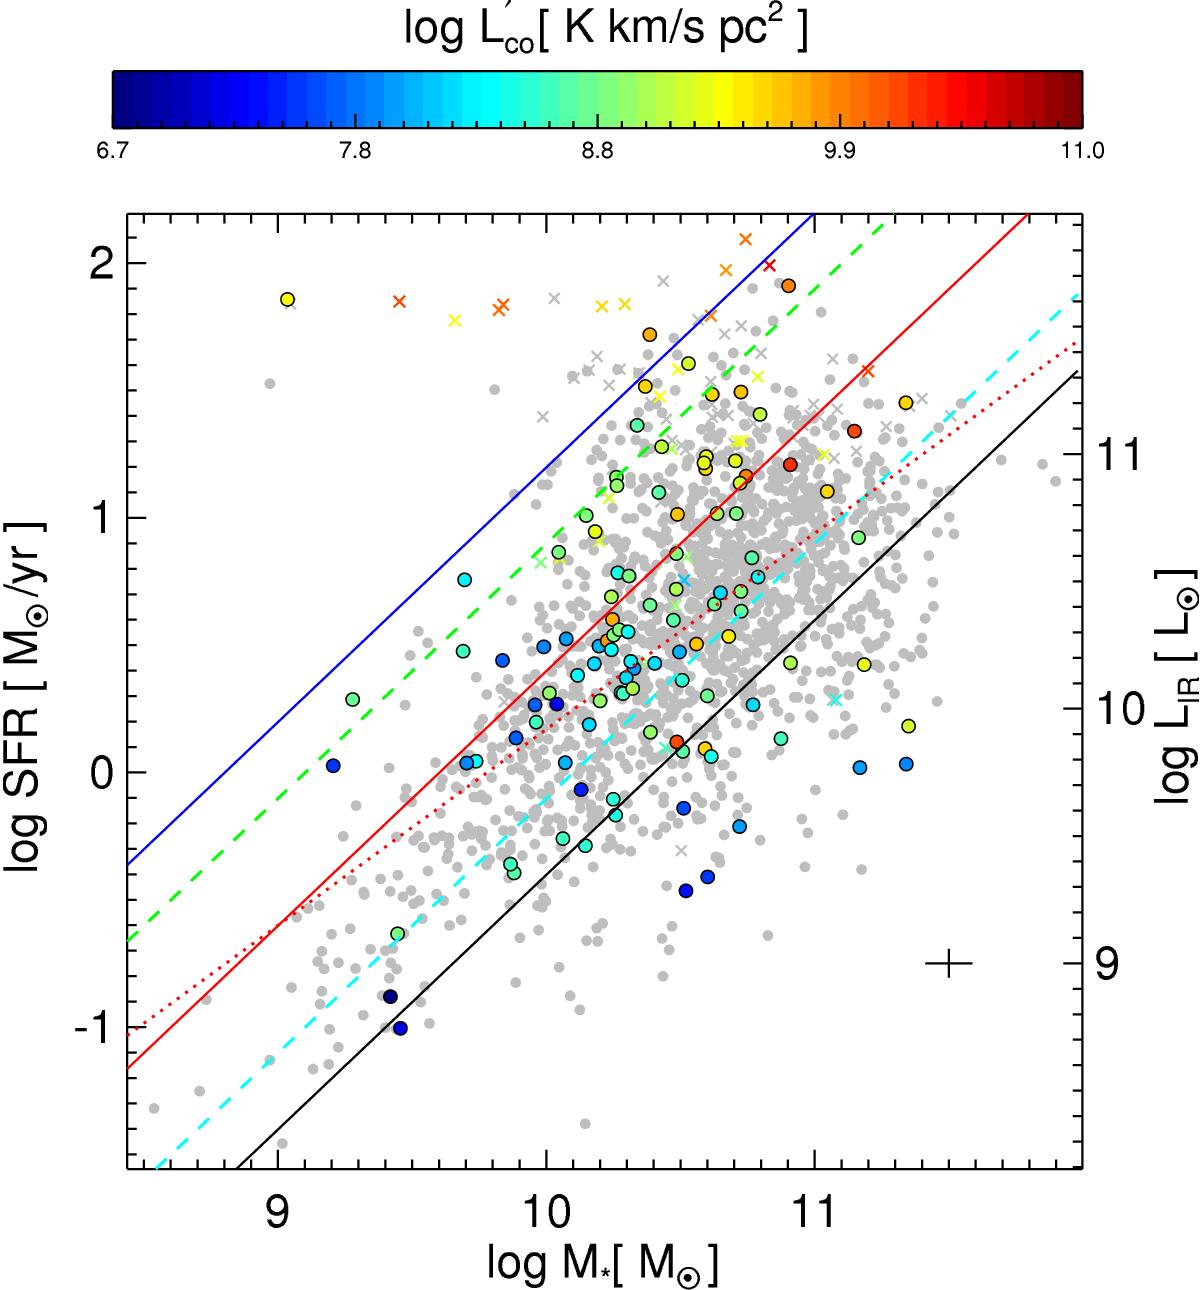
The star formation rate – stellar mass plane. Interacting galaxies are shown with Xs, and non-interacting galaxies (or those which we were unable to classify due to lack of deep imaging) with circles. Symbol colors indicate the CO J:1-0 luminosity, with gray denoting galaxies without global CO J:1-0 measurements. The red solid line shows the MS locus from Elbaz et al. (2011), and the red dotted line shows the MS locus from Elbaz et al. (2007). The other lines delineate the limits used to classify our sample in starburstiness: SB galaxies lie above the blue solid line; Intermediate-SB (InSB) galaxies lie between the blue solid and green dashed lines; normal star forming galaxies (MS) lie between the green dashed and the cyan dashed lines; and PAS galaxies lie below the black solid line. The typical error is shown in the bottom right corner.
Current usage metrics show cumulative count of Article Views (full-text article views including HTML views, PDF and ePub downloads, according to the available data) and Abstracts Views on Vision4Press platform.
Data correspond to usage on the plateform after 2015. The current usage metrics is available 48-96 hours after online publication and is updated daily on week days.
Initial download of the metrics may take a while.