Free Access
Fig. 6
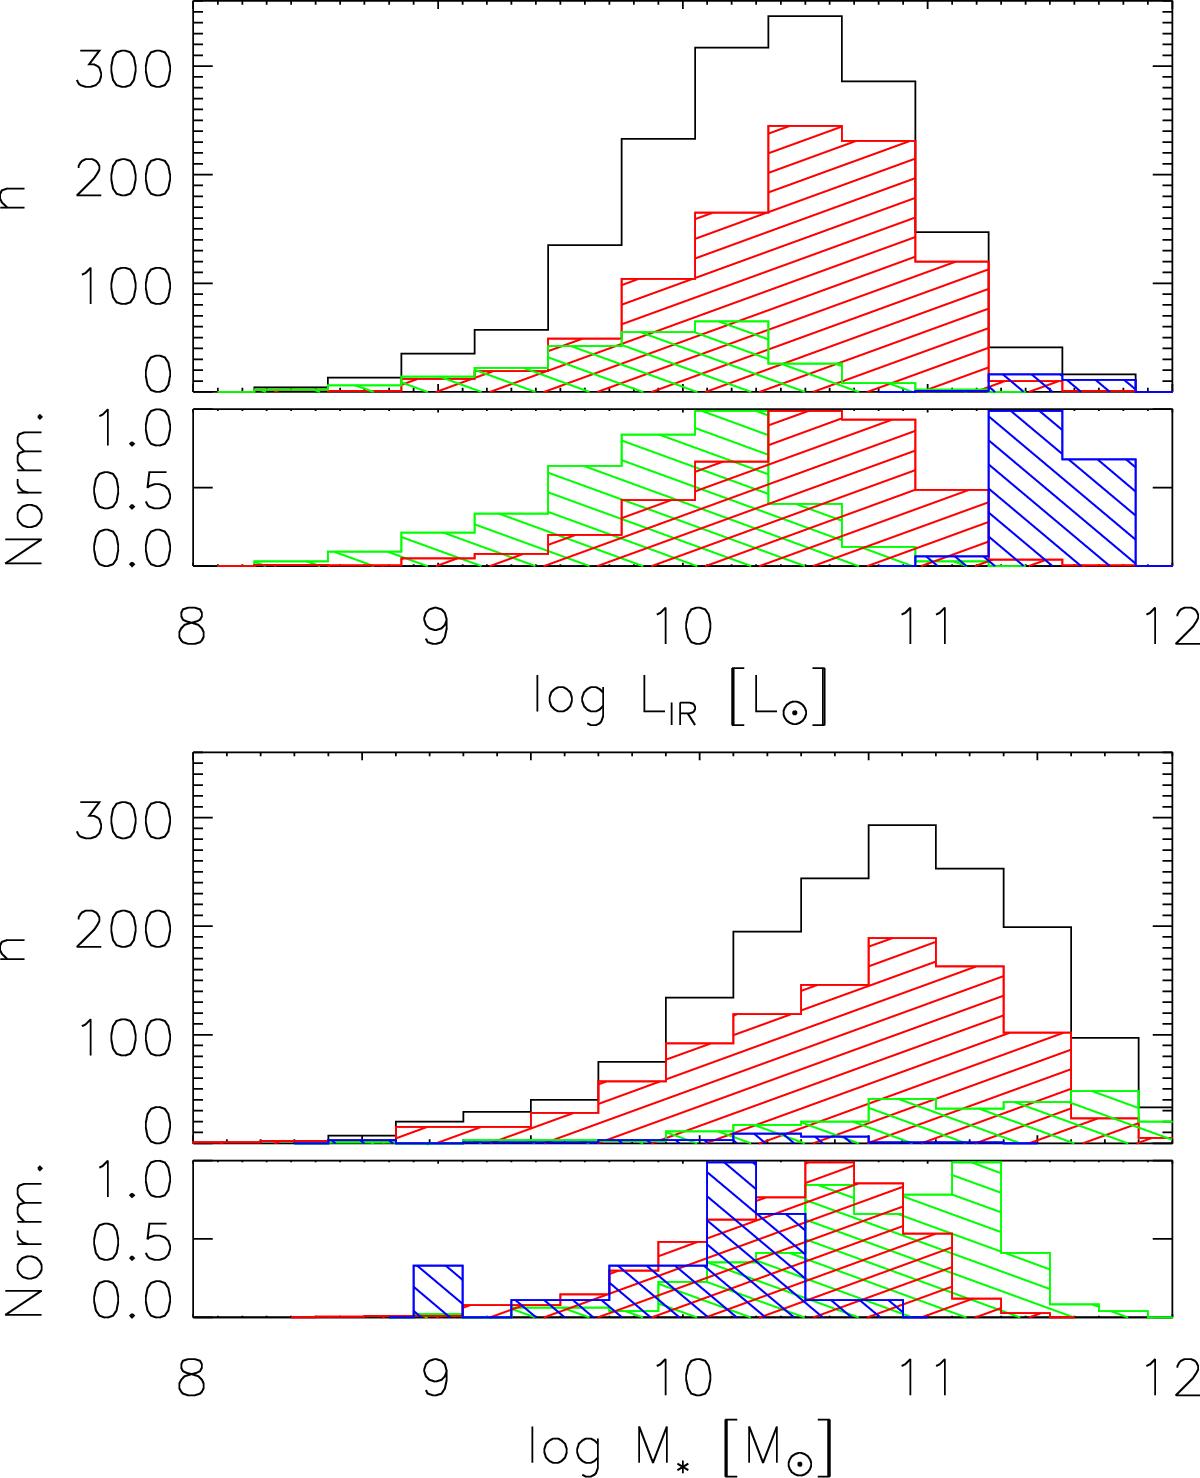
Distribution of LIR (from the DL07-model-fits; top panels) and stellar mass (following Cluver et al. 2014; bottom panels) for our sample. Histograms for our full sample (black), all SBs (blue), all MS (red) and all passive galaxies (green) are shown. The bottom sub-panels show the equivalent normalized histograms.
Current usage metrics show cumulative count of Article Views (full-text article views including HTML views, PDF and ePub downloads, according to the available data) and Abstracts Views on Vision4Press platform.
Data correspond to usage on the plateform after 2015. The current usage metrics is available 48-96 hours after online publication and is updated daily on week days.
Initial download of the metrics may take a while.