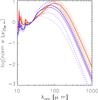
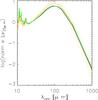
Fig. 5
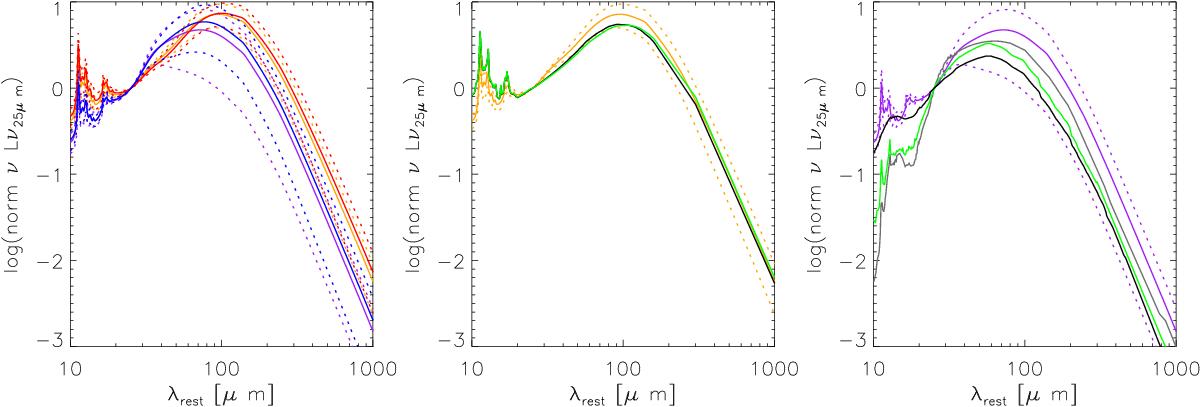
Left panel: composite SEDs of galaxies with normal sSFR (875 normal star forming galaxies; red) and high sSFR (26 SB galaxies; blue), for wavelengths between 10 and 1000 μm. The orange spectrum is from a subsample (277 templates) of the normal galaxies closest to the MS (− 0.5 < sSFR [yr-1] < 0.5, see Sect. 4.3). Similarly, the purple spectrum is a subsample (11 templates) of the most extreme SB galaxies in our sample (sSFR [yr-1] > 0.8). Middle panel: comparison of composite SED of the subsample of galaxies closest to the MS (orange) with templates of Sa and Sc galaxies (black and green, respectively, obtained from the SWIRE template library, see text). Right panel: comparison of composite SED of the subsample of the most extreme SB galaxies (purple) with spectra of Arp 220 (a starburst-ULIRG; gray), IRAS 22491-1808 (a starburst-ULIRG; green), and IRAS 19254-7245 South (a Seyfert 2-starburst-ULIRG; black). In all panels, the composite spectra are plotted using solid lines, and their corresponding dispersions (± 0.7σ) are plotted using dotted lines of the same color. All SEDs are normalized to the 25 μm luminosity (νLν25 μm) in order to best contrast changes in the SED peak (~100 μm), sub-mm luminosities, and PAH emission at ~ 5 to 11 μm. Note that our fits use data between 12 μm and 850 μm. Further, our composite spectra do not include a stellar component, and thus do not match the comparison spectra below ~ 10 μm.
Current usage metrics show cumulative count of Article Views (full-text article views including HTML views, PDF and ePub downloads, according to the available data) and Abstracts Views on Vision4Press platform.
Data correspond to usage on the plateform after 2015. The current usage metrics is available 48-96 hours after online publication and is updated daily on week days.
Initial download of the metrics may take a while.