Fig. 4
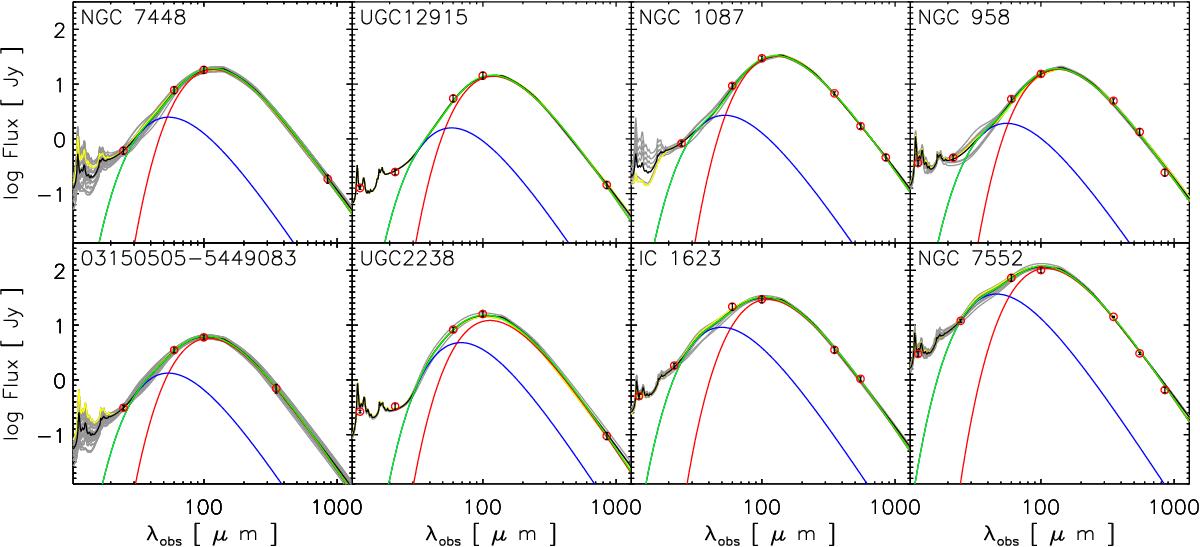
Examples of DL07 spectral energy distribution (SED) fits to galaxies in our sample, as named in each panel. Photometric data points are shown with red circles and corresponding black error bars. Panels are organized (left to right) by the number of photometric data points (4 to 7 points). The top (bottom) row shows “normal” star forming (starburst; SB) galaxies; (see Sect. 4.3). The single best-fit DL07 template SED is shown in yellow. All SEDs which satisfy the reduced χ2 criterion (see Sect. 3) are shown in gray; the weighted geometric mean of these is used as our FTF (shown in black). The two temperature component model fits (Eq. (7)) are shown in red (cold dust component), blue (warm dust component), and green (sum of cold and warm dust components).
Current usage metrics show cumulative count of Article Views (full-text article views including HTML views, PDF and ePub downloads, according to the available data) and Abstracts Views on Vision4Press platform.
Data correspond to usage on the plateform after 2015. The current usage metrics is available 48-96 hours after online publication and is updated daily on week days.
Initial download of the metrics may take a while.