Free Access
Fig. 3
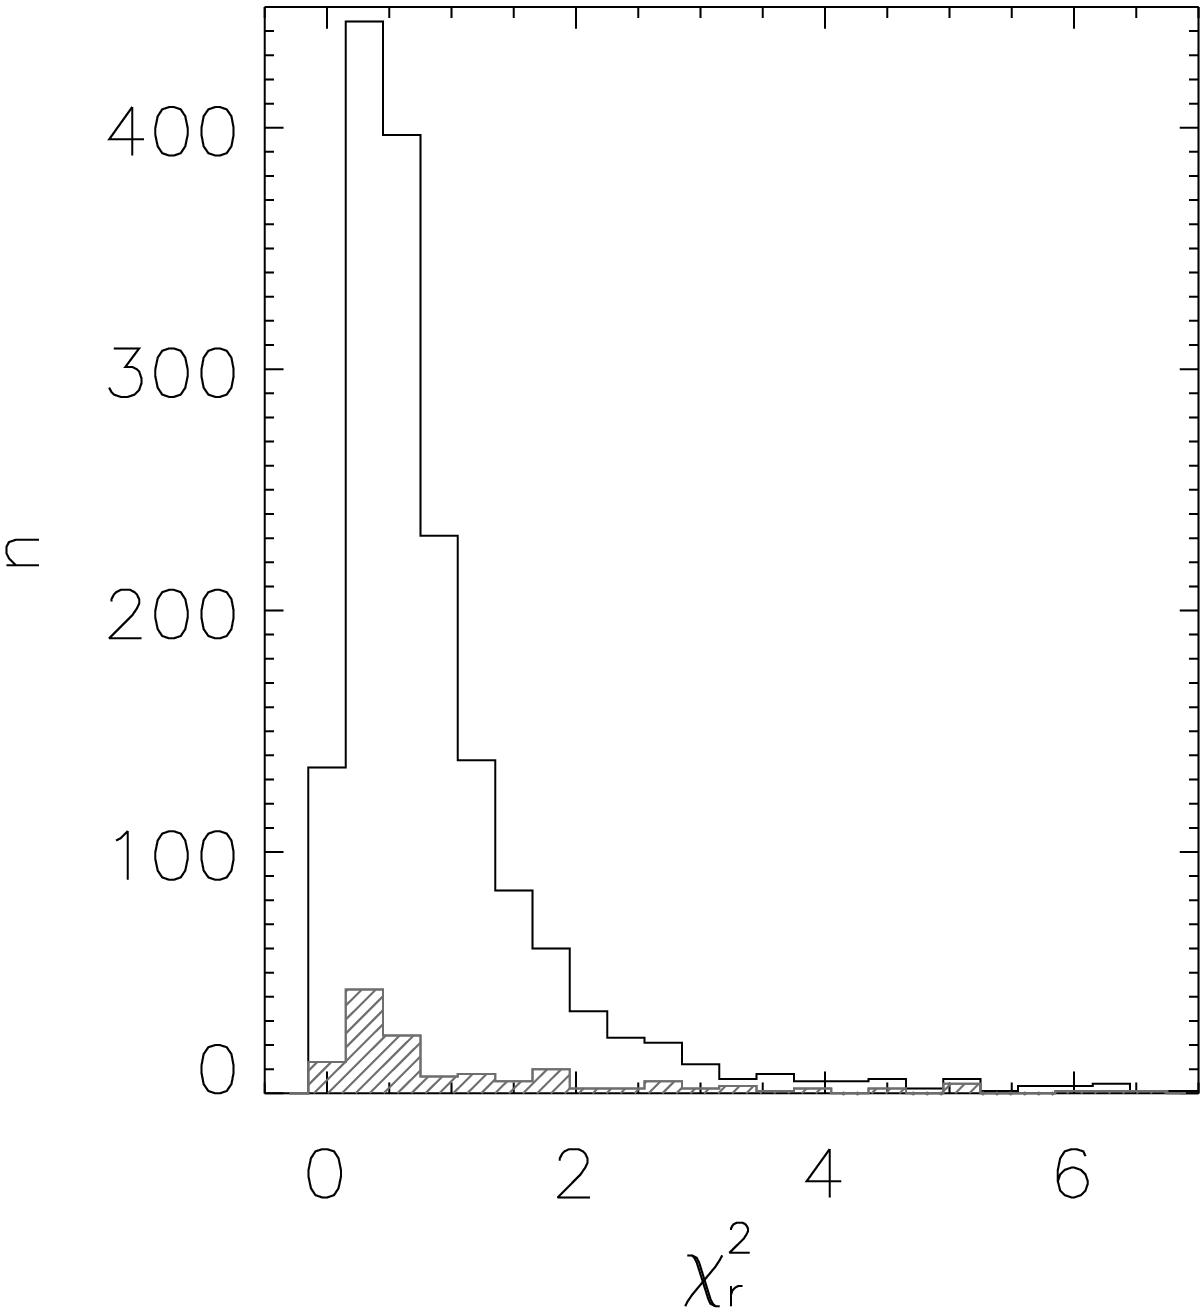
The histogram of the reduced χ2![]() distribution obtained for the DL07 model fits to our sample galaxes. The gray histogram shows the distribution for the subset of sources with CO observations.
distribution obtained for the DL07 model fits to our sample galaxes. The gray histogram shows the distribution for the subset of sources with CO observations.
Current usage metrics show cumulative count of Article Views (full-text article views including HTML views, PDF and ePub downloads, according to the available data) and Abstracts Views on Vision4Press platform.
Data correspond to usage on the plateform after 2015. The current usage metrics is available 48-96 hours after online publication and is updated daily on week days.
Initial download of the metrics may take a while.