Free Access
Fig. E.5
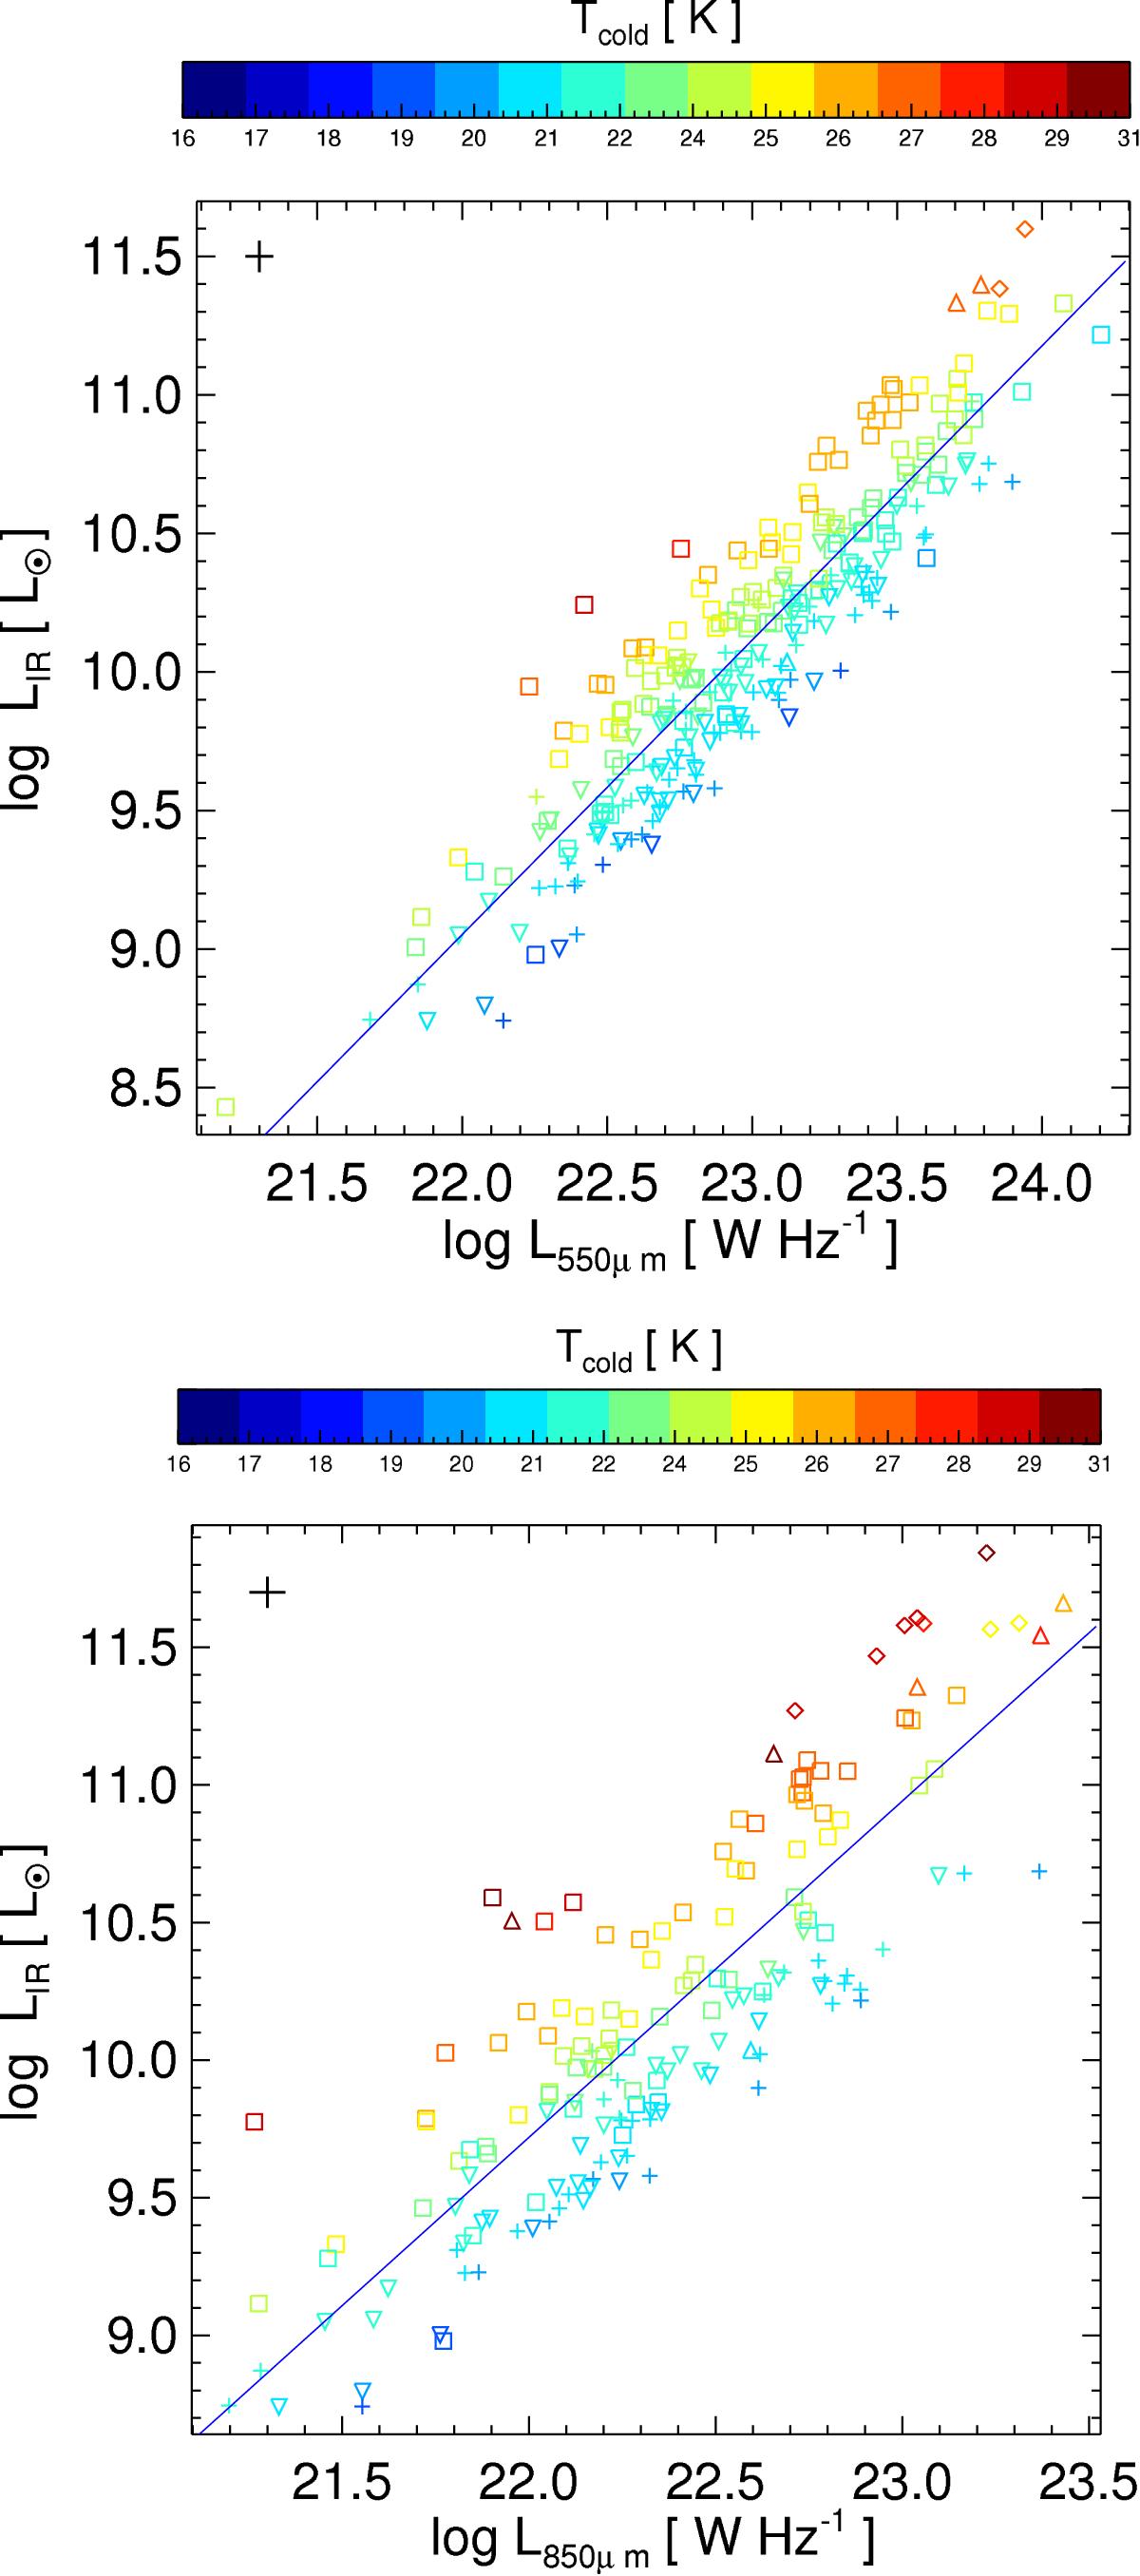
Correlation between total LIR and the luminosities at 550 μm (top panel) and 850 μm (bottom panel). The dust temperature (in K) of the cold component is shown by the color-scale. The blue line shows the best fit. Symbols are as shown in Fig. 10. The black cross shows the typical error.
This figure is made of several images, please see below:
Current usage metrics show cumulative count of Article Views (full-text article views including HTML views, PDF and ePub downloads, according to the available data) and Abstracts Views on Vision4Press platform.
Data correspond to usage on the plateform after 2015. The current usage metrics is available 48-96 hours after online publication and is updated daily on week days.
Initial download of the metrics may take a while.