Fig. E.2
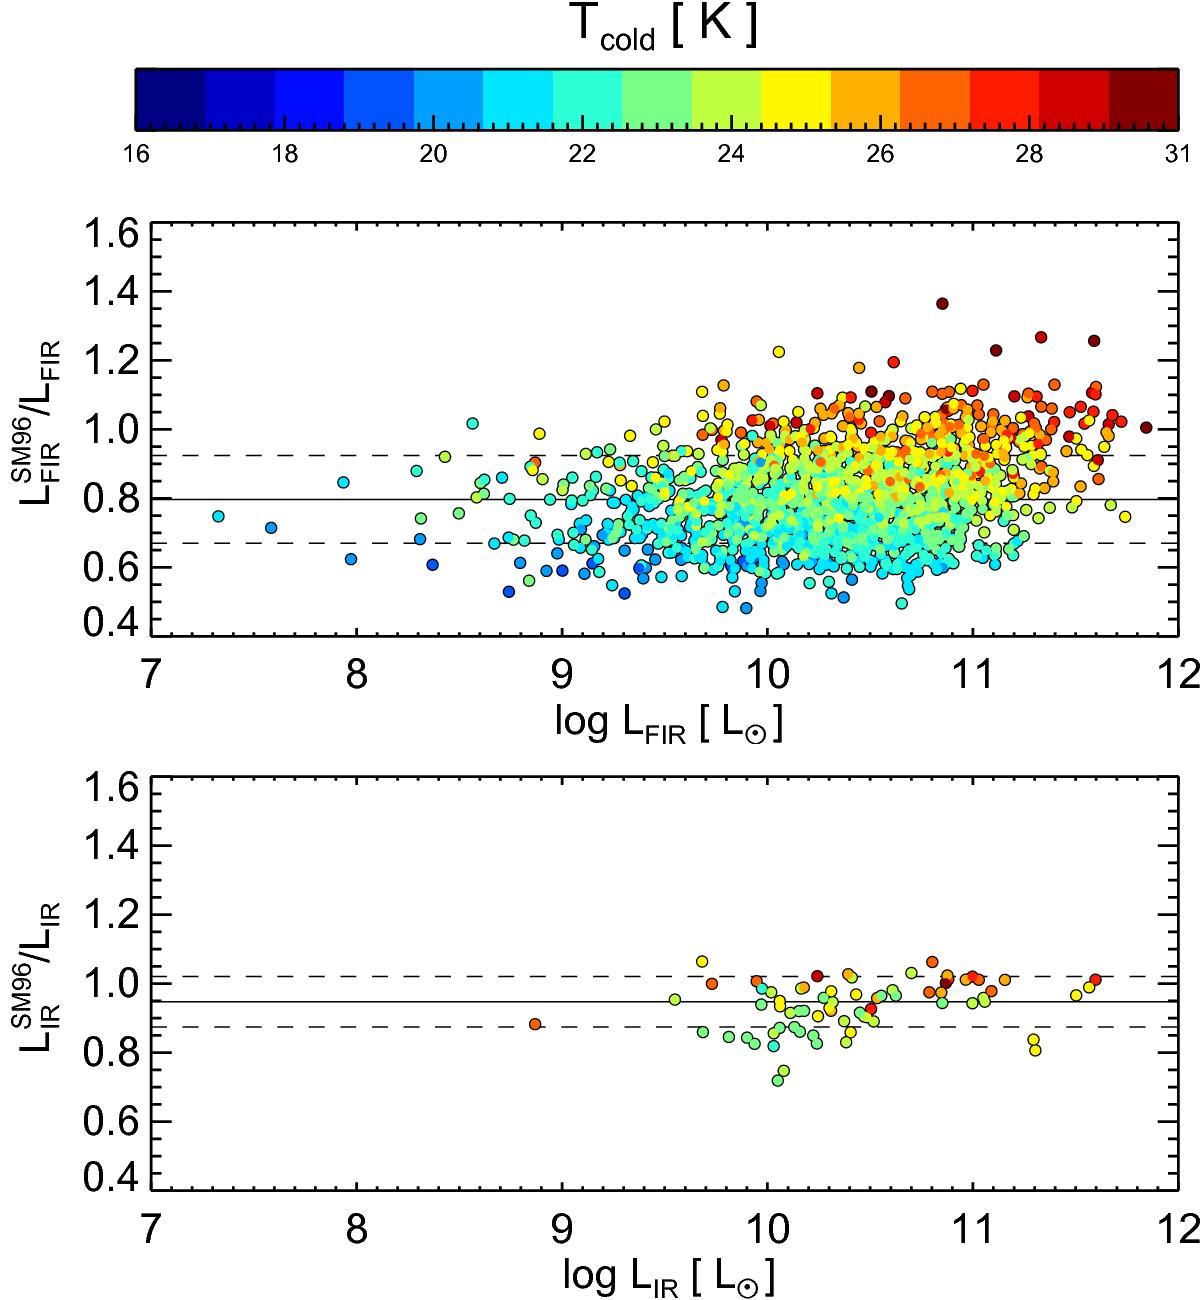
Top panel (bottom-panel): comparison between the ratio of LFIR ( LIR ) obtained by Sanders & Mirabel (1996) equations and with the direct integration of our final templates. The solid line shows the median value and colors represent the dust temperature (in K) of the cold component. Dashed lines represent the 1σ dispersion.
Current usage metrics show cumulative count of Article Views (full-text article views including HTML views, PDF and ePub downloads, according to the available data) and Abstracts Views on Vision4Press platform.
Data correspond to usage on the plateform after 2015. The current usage metrics is available 48-96 hours after online publication and is updated daily on week days.
Initial download of the metrics may take a while.