Fig. D.1
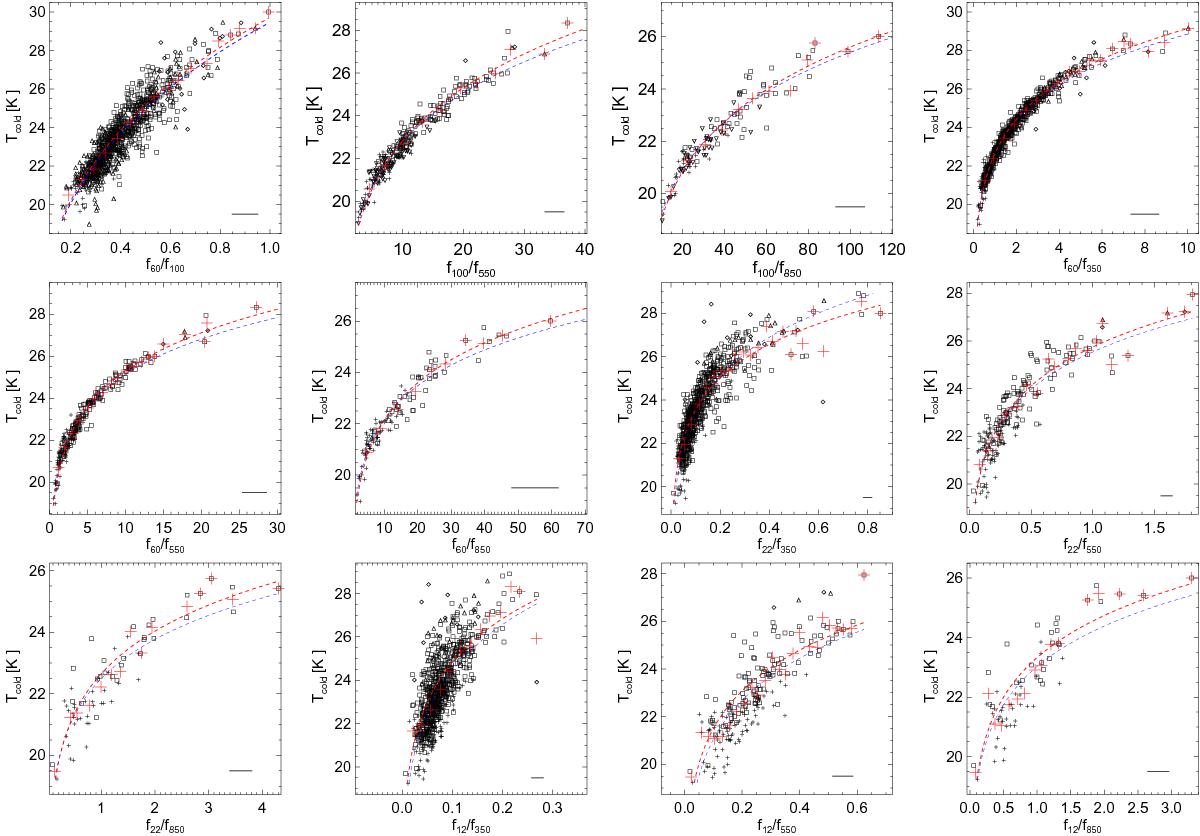
Relation between IR and sub-mm colors (with exception of the first panel, which is the color f60/f100) and the dust temperature of the cold component (fλ, λ in μm). This relation is shown only for galaxies with five or more photometric measurements and ![]() . The large, red crosses show the mean values of Tcold in different color bins. The blue dashed curves are the best fit lines for all points, while the red dashed curves are the best fit lines for the large red crosses. Symbols represent MS galaxies (squares), SB galaxies (diamonds), PAS galaxies (crosses) and intermediate SB galaxies (triangles). The black horizontal line shows the typical error in the flux ratio.
. The large, red crosses show the mean values of Tcold in different color bins. The blue dashed curves are the best fit lines for all points, while the red dashed curves are the best fit lines for the large red crosses. Symbols represent MS galaxies (squares), SB galaxies (diamonds), PAS galaxies (crosses) and intermediate SB galaxies (triangles). The black horizontal line shows the typical error in the flux ratio.
Current usage metrics show cumulative count of Article Views (full-text article views including HTML views, PDF and ePub downloads, according to the available data) and Abstracts Views on Vision4Press platform.
Data correspond to usage on the plateform after 2015. The current usage metrics is available 48-96 hours after online publication and is updated daily on week days.
Initial download of the metrics may take a while.