Fig. C.1
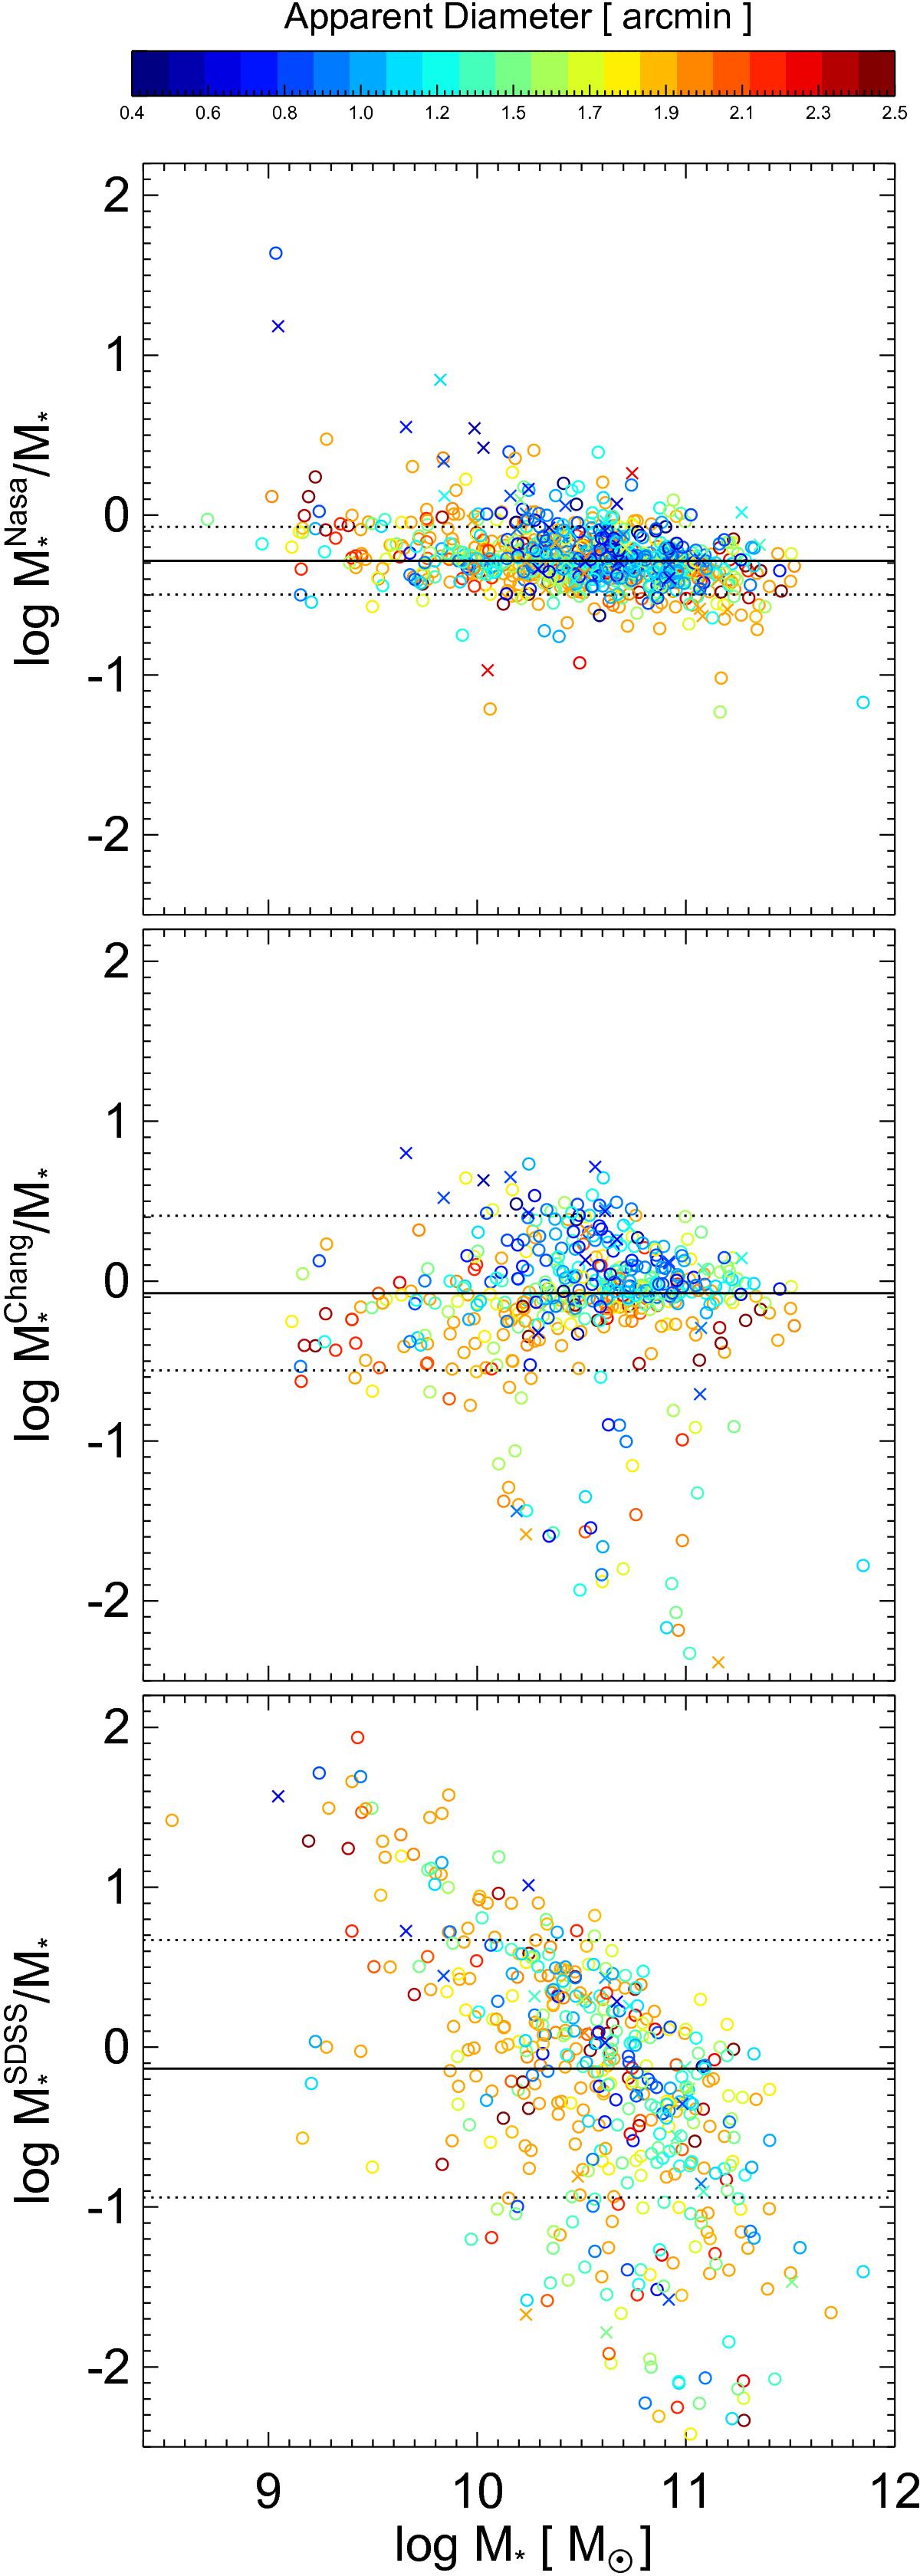
Comparison between stellar mass estimates and the ratio between the NASA Sloan Atlas estimation (top), the (Chang et al. 2015) estimation (middle) and the MPA-JHU estimation (bottom) with our stellar mass. The solid line shows the median value and dashed lines show the ± 1σ dispersion. Colors represent the apparent diameter of the galaxies in arcminutes. Crosses show sources classified as interacting galaxies and circles show non-interacting galaxies.
Current usage metrics show cumulative count of Article Views (full-text article views including HTML views, PDF and ePub downloads, according to the available data) and Abstracts Views on Vision4Press platform.
Data correspond to usage on the plateform after 2015. The current usage metrics is available 48-96 hours after online publication and is updated daily on week days.
Initial download of the metrics may take a while.