Fig. A.1
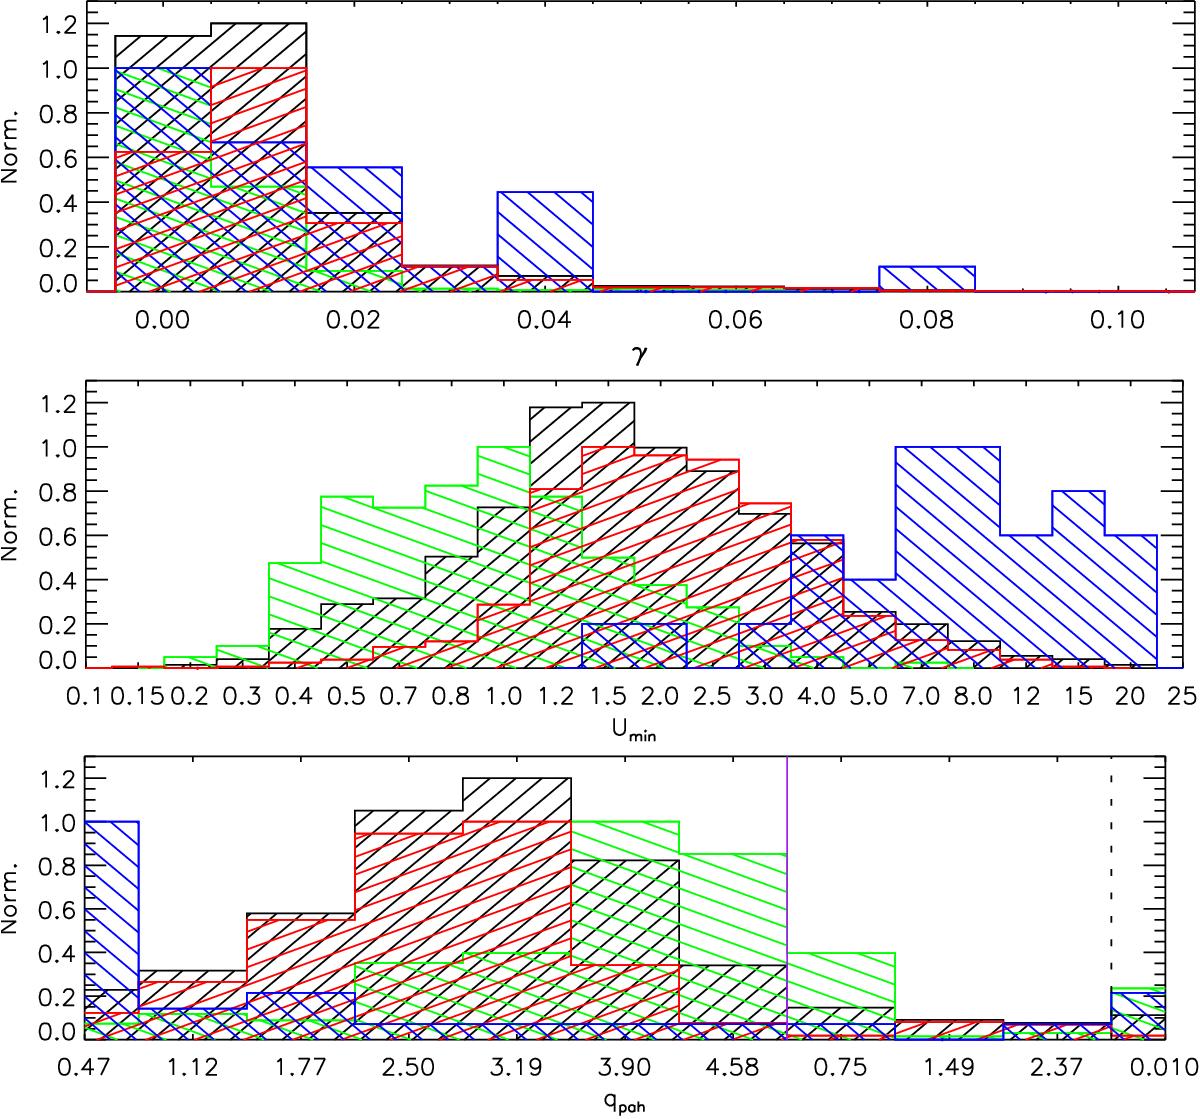
Normalized distributions of the dust-mass fraction heated by PDRs (γ; top panel), the constant intensity of the radiation field (Umin; middle) and the polycyclic aromatic hydrocarbon index (qPAH; bottom) of the DL07 templates used in our sample. Histograms show the distribution of the full sample (black), SB (blue), MS (red), and PAS (green) galaxies. In the bottom panel the qpah histogram is divided in three groups of values, shown by the purple solid and black dashed lines: Milky Way models (left side of the solid line), the Large Magellanic Cloud (between purple solid and black dashed lines), and the Small Magellanic Cloud (right side of the black dashed line).
Current usage metrics show cumulative count of Article Views (full-text article views including HTML views, PDF and ePub downloads, according to the available data) and Abstracts Views on Vision4Press platform.
Data correspond to usage on the plateform after 2015. The current usage metrics is available 48-96 hours after online publication and is updated daily on week days.
Initial download of the metrics may take a while.