Fig. 18
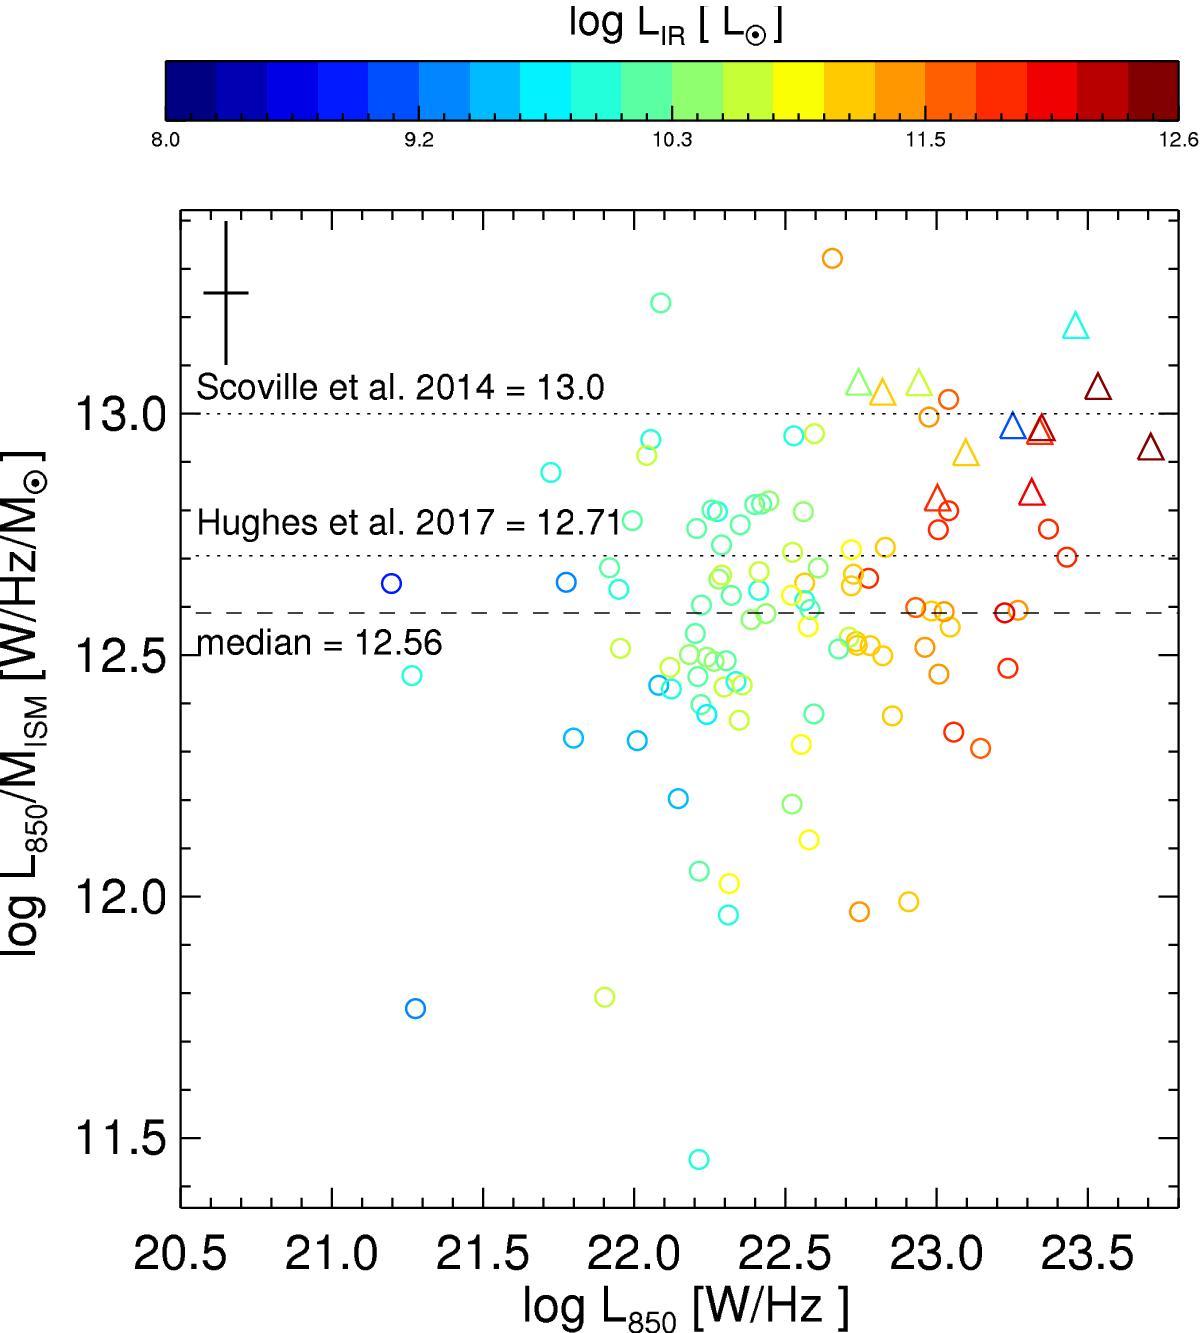
Ratio of the monochromatic luminosity at 850 μm to the ISM mass as a function of monochromatic luminosity at 850 μm. Circles show galaxies of our sample and large triangles show galaxies from Scoville et al. (2014). Symbols are colored by the LIR following the color bar. The median value for our sample is shown by the dashed line, while dotted lines show the median values obtained by Scoville et al. (2014) and by Hughes et al. (2017). The black cross shows the typical error.
Current usage metrics show cumulative count of Article Views (full-text article views including HTML views, PDF and ePub downloads, according to the available data) and Abstracts Views on Vision4Press platform.
Data correspond to usage on the plateform after 2015. The current usage metrics is available 48-96 hours after online publication and is updated daily on week days.
Initial download of the metrics may take a while.