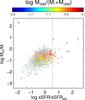
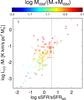
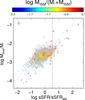
Fig. 17

Atomic hydrogen mass (left), ![]() (middle) and dust mass (right) to stellar mass ratio as a function of the distance to the MS (sSFR/sSFRMS). Symbols are the same as Fig. 16. Symbols are colored by gas fraction, with gray symbols used for sources with unknown gas fraction. The vertical line divides the galaxies with low and normal sSFR (PAS, InPAS and MS to the left), and galaxies with high sSFR (InSB and SB to the right). The black cross shows the typical error.
(middle) and dust mass (right) to stellar mass ratio as a function of the distance to the MS (sSFR/sSFRMS). Symbols are the same as Fig. 16. Symbols are colored by gas fraction, with gray symbols used for sources with unknown gas fraction. The vertical line divides the galaxies with low and normal sSFR (PAS, InPAS and MS to the left), and galaxies with high sSFR (InSB and SB to the right). The black cross shows the typical error.
Current usage metrics show cumulative count of Article Views (full-text article views including HTML views, PDF and ePub downloads, according to the available data) and Abstracts Views on Vision4Press platform.
Data correspond to usage on the plateform after 2015. The current usage metrics is available 48-96 hours after online publication and is updated daily on week days.
Initial download of the metrics may take a while.