Fig. 16
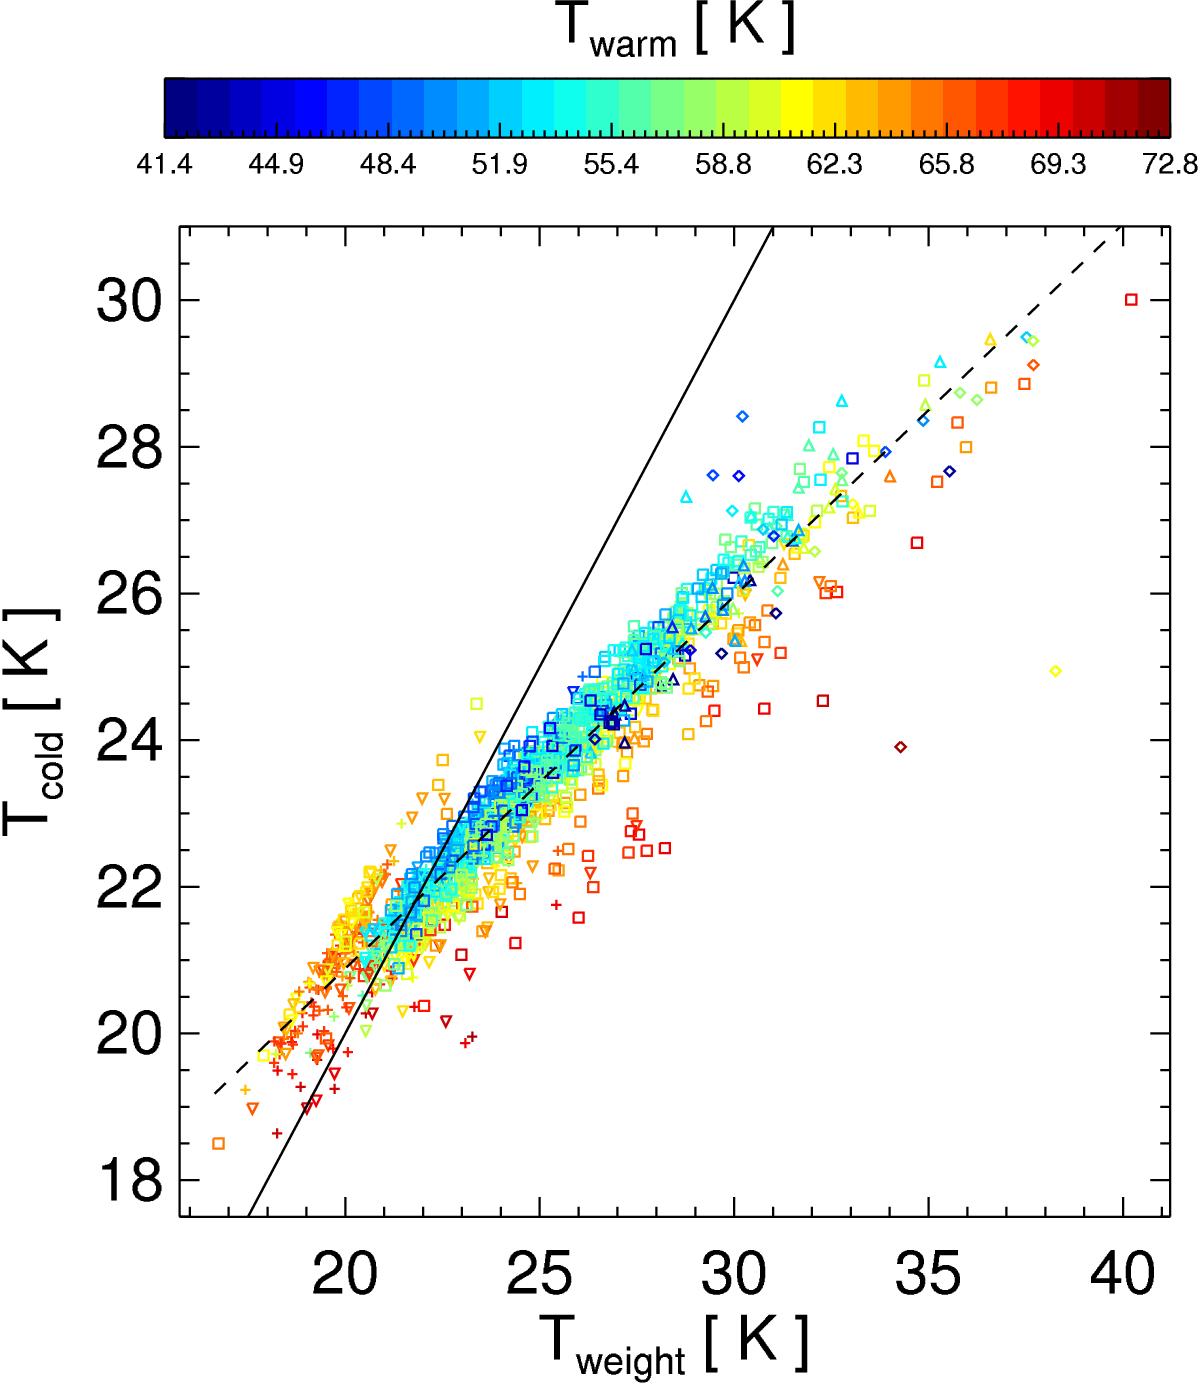
A comparison of the temperature of the cold dust component (Tcold; from the two component fit) and the luminosity weighted temperature (Tweight) for our sample. The different symbols show SBs (diamonds), MS (squares), PAS (crosses), intermediate SB (upward triangles) and intermediate PAS (downward triangles) galaxies. Symbols are color-coded by the temperature of the warm dust component following the color bar. The dashed and solid lines show the best fit and the line of equality, respectively.
Current usage metrics show cumulative count of Article Views (full-text article views including HTML views, PDF and ePub downloads, according to the available data) and Abstracts Views on Vision4Press platform.
Data correspond to usage on the plateform after 2015. The current usage metrics is available 48-96 hours after online publication and is updated daily on week days.
Initial download of the metrics may take a while.