Fig. 14
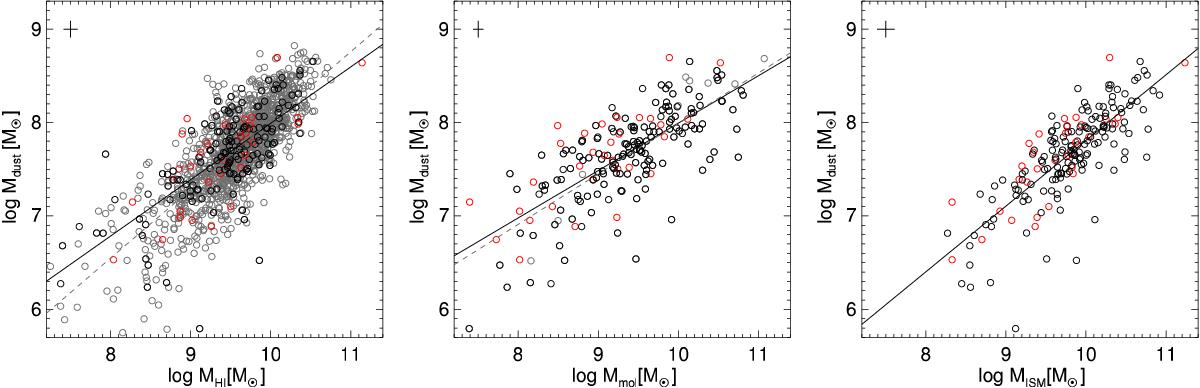
Relationships between dust mass and atomic gas mass (left), molecular gas mass (middle) and total ISM mass (right). Black symbols are used for galaxies with HI and CO observations and dust mass from DL07 models; red symbols are used for galaxies with HI and CO observations, but with dust masses estimated from the luminosity at 350, 550 or 850 μm (see Eq. (16) and Appendix F); Gray symbols denote galaxies with either HI or CO observations and dust mass from DL07 models. The solid black lines in each panel show the best fit to all sources with measurements of both MHI and Mmol, and the gray dashed lines in the two left panels show the fit to all points in the respective panel. The typical error is shown by the black cross in each panel.
Current usage metrics show cumulative count of Article Views (full-text article views including HTML views, PDF and ePub downloads, according to the available data) and Abstracts Views on Vision4Press platform.
Data correspond to usage on the plateform after 2015. The current usage metrics is available 48-96 hours after online publication and is updated daily on week days.
Initial download of the metrics may take a while.