Fig. 13
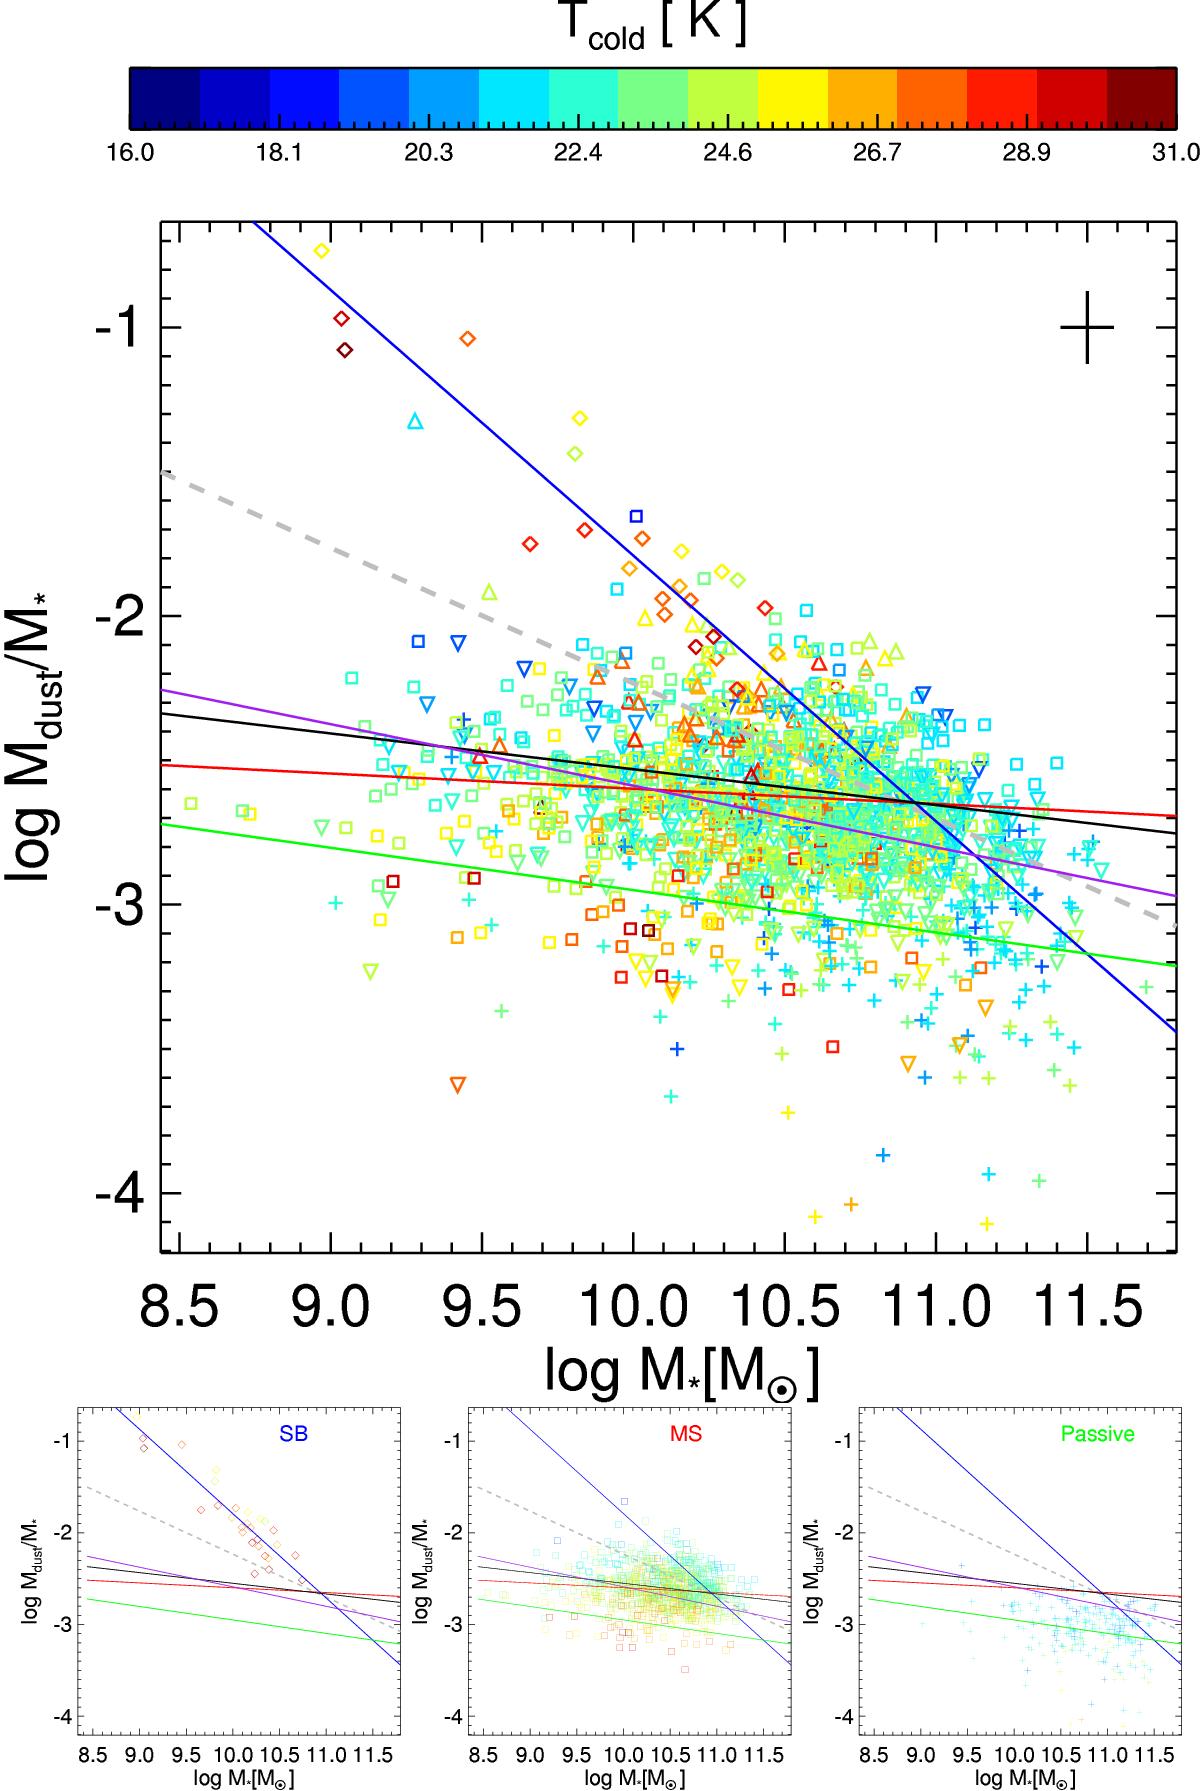
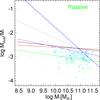
Top panel: dust to stellar mass ratio (![]() ) as a function of stellar mass. The dust mass is that obtained from the DL07 model fits. Symbols are the same as in Fig. 10 and symbol colors denote the temperature of the cold dust component following the color bar. The dashed gray line shows the relation obtained by Clements et al. (2010). The linear fits to the data points of our sub-samples are shown in blue for SB galaxies, red for MS galaxies, green for PAS galaxies, black for MS and SB galaxies combined, and purple for our entire sample. The typical error is shown by the black cross. Bottom panels: as in the top panel, but the panels separately plot SB (left), MS (middle) and PAS galaxies (right).
) as a function of stellar mass. The dust mass is that obtained from the DL07 model fits. Symbols are the same as in Fig. 10 and symbol colors denote the temperature of the cold dust component following the color bar. The dashed gray line shows the relation obtained by Clements et al. (2010). The linear fits to the data points of our sub-samples are shown in blue for SB galaxies, red for MS galaxies, green for PAS galaxies, black for MS and SB galaxies combined, and purple for our entire sample. The typical error is shown by the black cross. Bottom panels: as in the top panel, but the panels separately plot SB (left), MS (middle) and PAS galaxies (right).
Current usage metrics show cumulative count of Article Views (full-text article views including HTML views, PDF and ePub downloads, according to the available data) and Abstracts Views on Vision4Press platform.
Data correspond to usage on the plateform after 2015. The current usage metrics is available 48-96 hours after online publication and is updated daily on week days.
Initial download of the metrics may take a while.