Fig. 12
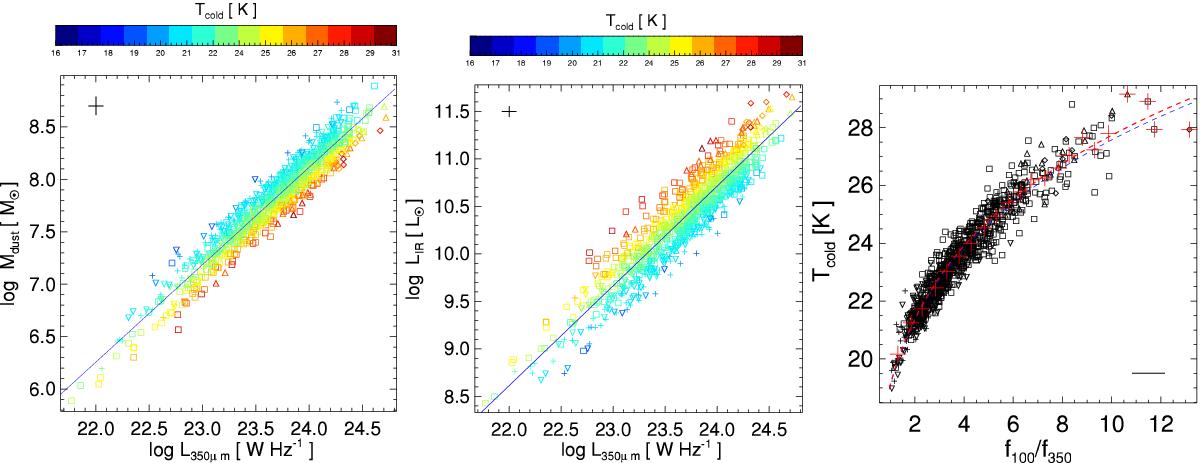
Left and middle panels: dependence of the dust mass and IR luminosity on the 350 μm monochromatic luminosity. Symbol colors show the temperature of the cold dust component, and the blue line shows the best fit. The typical error is shown by the black cross. Equivalent figures for monochromatic luminosities at 550 μm and 850 μm can be found in Appendices E and F. Right panel: correlation between the temperature of the cold dust component and the 100 μm to 350 μm flux ratio, with the best fit shown by the dashed blue line. Large, red crosses show the mean value of Tcold in 0.5 mag color bins, and the red dashed curve corresponds to the best fit line to the red crosses. The typical error in the x-axis is shown by the black horizontal line. Similar plots relating Tcold to IR and sub-mm colors can be found in Appendix D. In all panels the symbols are the same as in Fig. 10.
Current usage metrics show cumulative count of Article Views (full-text article views including HTML views, PDF and ePub downloads, according to the available data) and Abstracts Views on Vision4Press platform.
Data correspond to usage on the plateform after 2015. The current usage metrics is available 48-96 hours after online publication and is updated daily on week days.
Initial download of the metrics may take a while.