Fig. 11
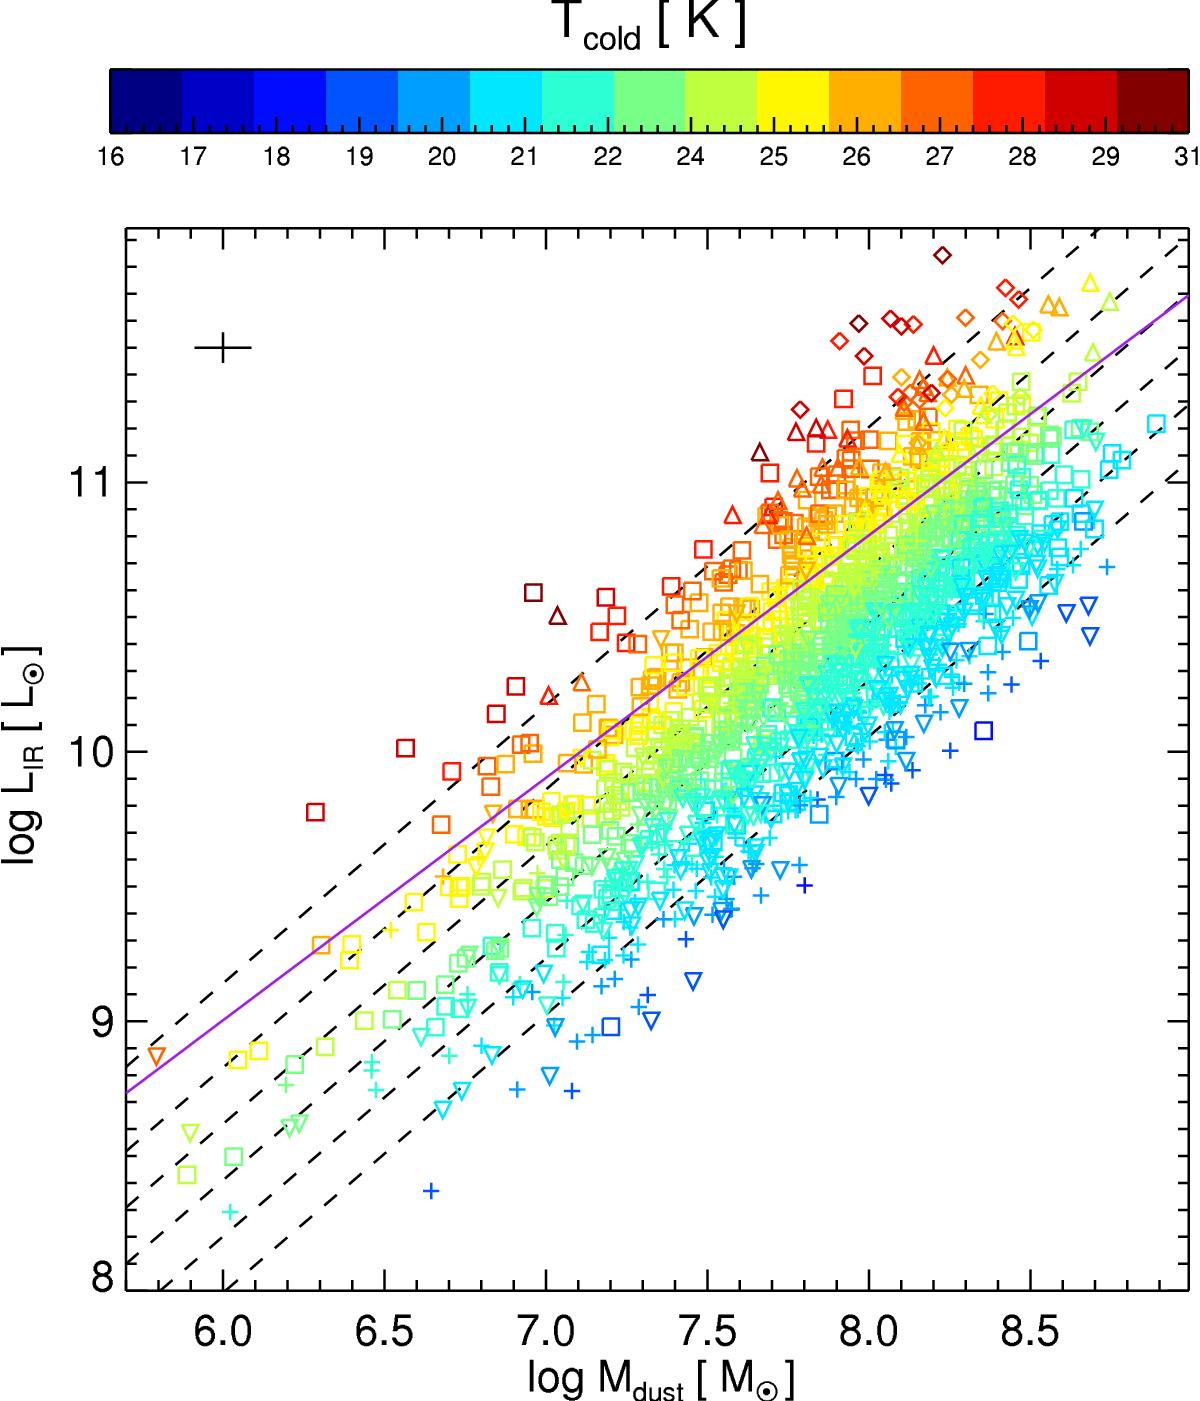
Relationship between IR luminosity (thus SFR) and dust mass for our sample, with the symbols colored by the temperature of the cold dust component. The figure is a projection of the dust plane we find between LIR , Mdust , and Tcold . Symbols – which denote the sSFR classification of the galaxies – are the same as in Fig. 10. The black dashed lines are the fits to the LIR –Mdust plane for cold component dust temperature bins centered at (bottom to top) 20, 22, 24, 26 and 28 K. The purple line shows the relationship between LIR and Mdust obtained by da Cunha et al. (2010) where dust temperature is not taken into account. The typical error is shown in the top right of the plot.
Current usage metrics show cumulative count of Article Views (full-text article views including HTML views, PDF and ePub downloads, according to the available data) and Abstracts Views on Vision4Press platform.
Data correspond to usage on the plateform after 2015. The current usage metrics is available 48-96 hours after online publication and is updated daily on week days.
Initial download of the metrics may take a while.