Fig. 5
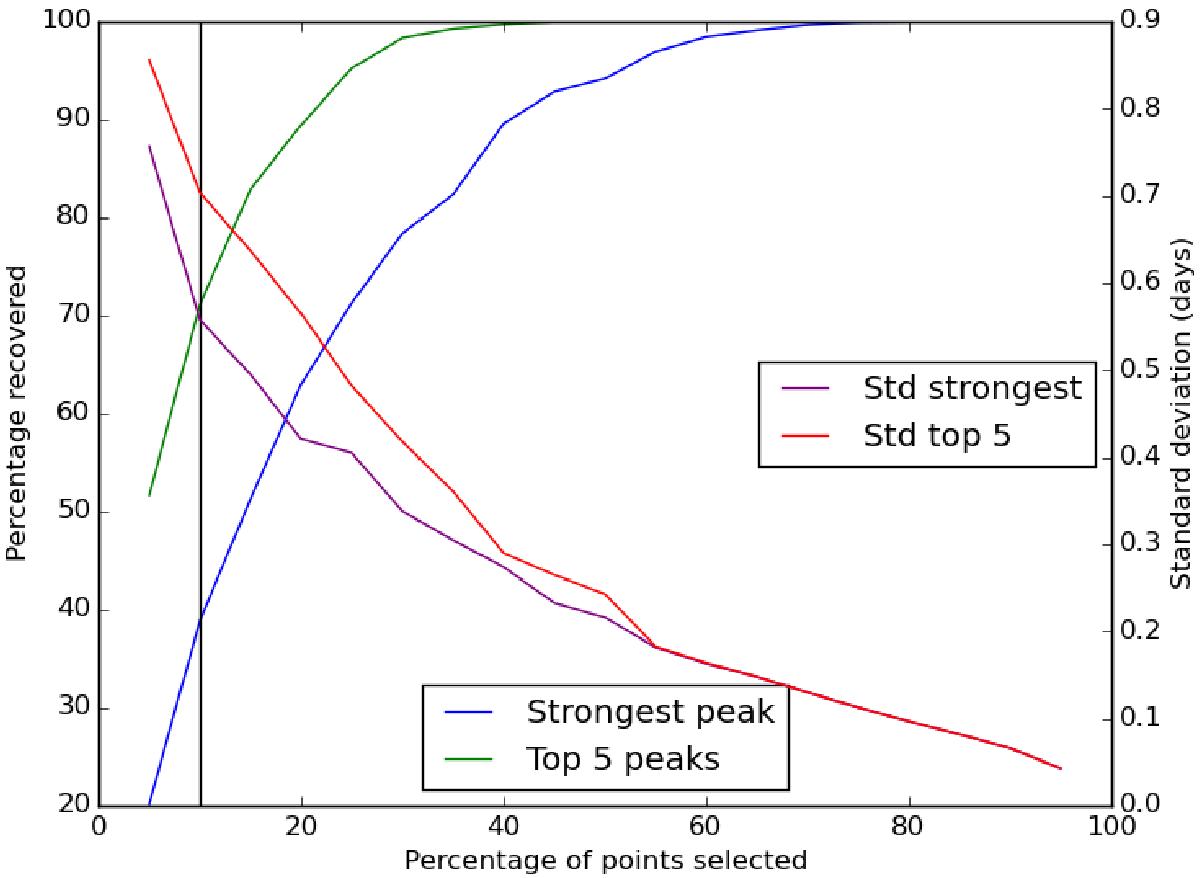
Illustration of the effects of randomly selecting a given proportion of the ASAS data in terms of whether the same period of 82.6 days is recovered and the error in this result. The black vertical line represents the proportion of the ASAS data which corresponds to the number of spectra in the clipped and binned to one day HARPS data so that the relative performances of the spectroscopic results can be compared.
Current usage metrics show cumulative count of Article Views (full-text article views including HTML views, PDF and ePub downloads, according to the available data) and Abstracts Views on Vision4Press platform.
Data correspond to usage on the plateform after 2015. The current usage metrics is available 48-96 hours after online publication and is updated daily on week days.
Initial download of the metrics may take a while.