Fig. 3
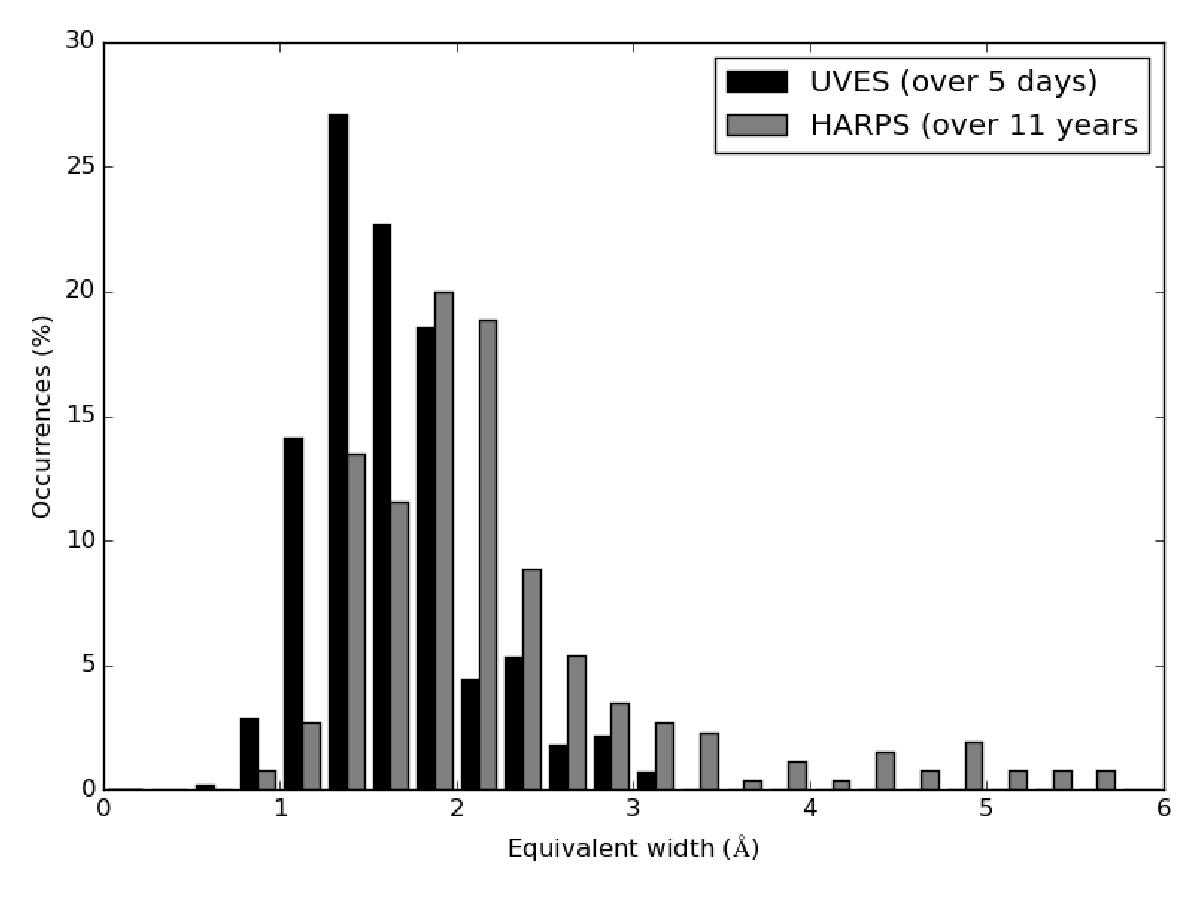
Histograms of equivalent widths for UVES in blue and HARPS in green, expressed as percentages with the same X axis scale. All the UVES spectra results are shown apart from those for one which appeared to be just noise (12 March 2009 UTC 02:31:11). HARPS spectra are omitted for four outlying cases which appeared to be dominated by flares at 16 July 2004 UTC 01:52:40, 27 March 2011 UTC 05:20:09, 05 May 2013 UTC 03:31:16 and 5 May 2013 UTC 03:41:47 with values of 21.69, 18.12, 6.76 and 6.19 respectively.
Current usage metrics show cumulative count of Article Views (full-text article views including HTML views, PDF and ePub downloads, according to the available data) and Abstracts Views on Vision4Press platform.
Data correspond to usage on the plateform after 2015. The current usage metrics is available 48-96 hours after online publication and is updated daily on week days.
Initial download of the metrics may take a while.