Fig. 2
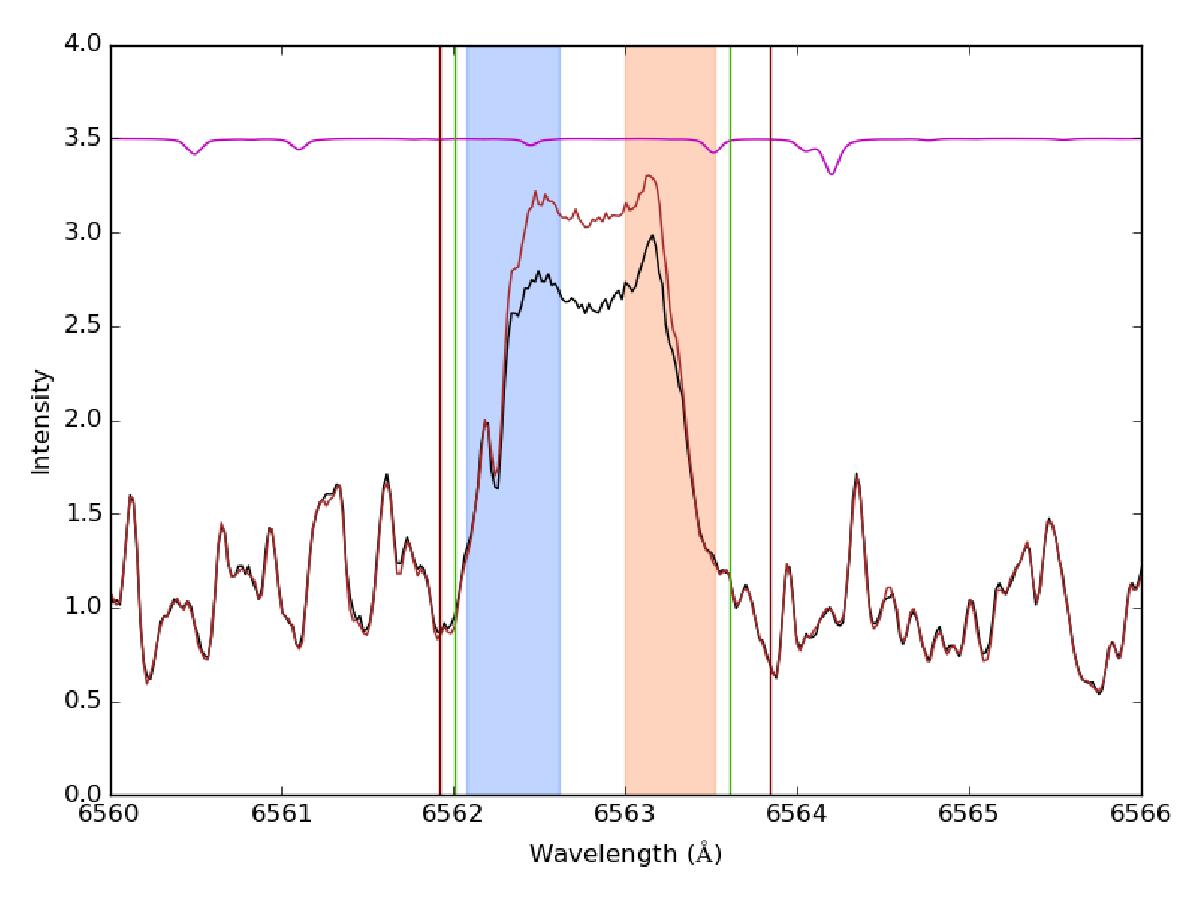
The Hα region of example spectra of Proxima Centauri taken from HARPS on 27 May 2004 02:10:14 UTC (black) and 15 March 2006 09:16:35 (brown). The region delineated with the dark red solid vertical lines shows the region used for calculation of the Hα equivalent width in this paper. The regions shaded in red and blue respectively show the regions used for calculation of the sizes of the two sub-peaks. The vertical purple lines mark the region chosen for calculation of the equivalent width and the vertical green lines mark the region chosen in Suárez Mascareño et al. (2015) for calculation of the Hα index.
Current usage metrics show cumulative count of Article Views (full-text article views including HTML views, PDF and ePub downloads, according to the available data) and Abstracts Views on Vision4Press platform.
Data correspond to usage on the plateform after 2015. The current usage metrics is available 48-96 hours after online publication and is updated daily on week days.
Initial download of the metrics may take a while.