Fig. 1
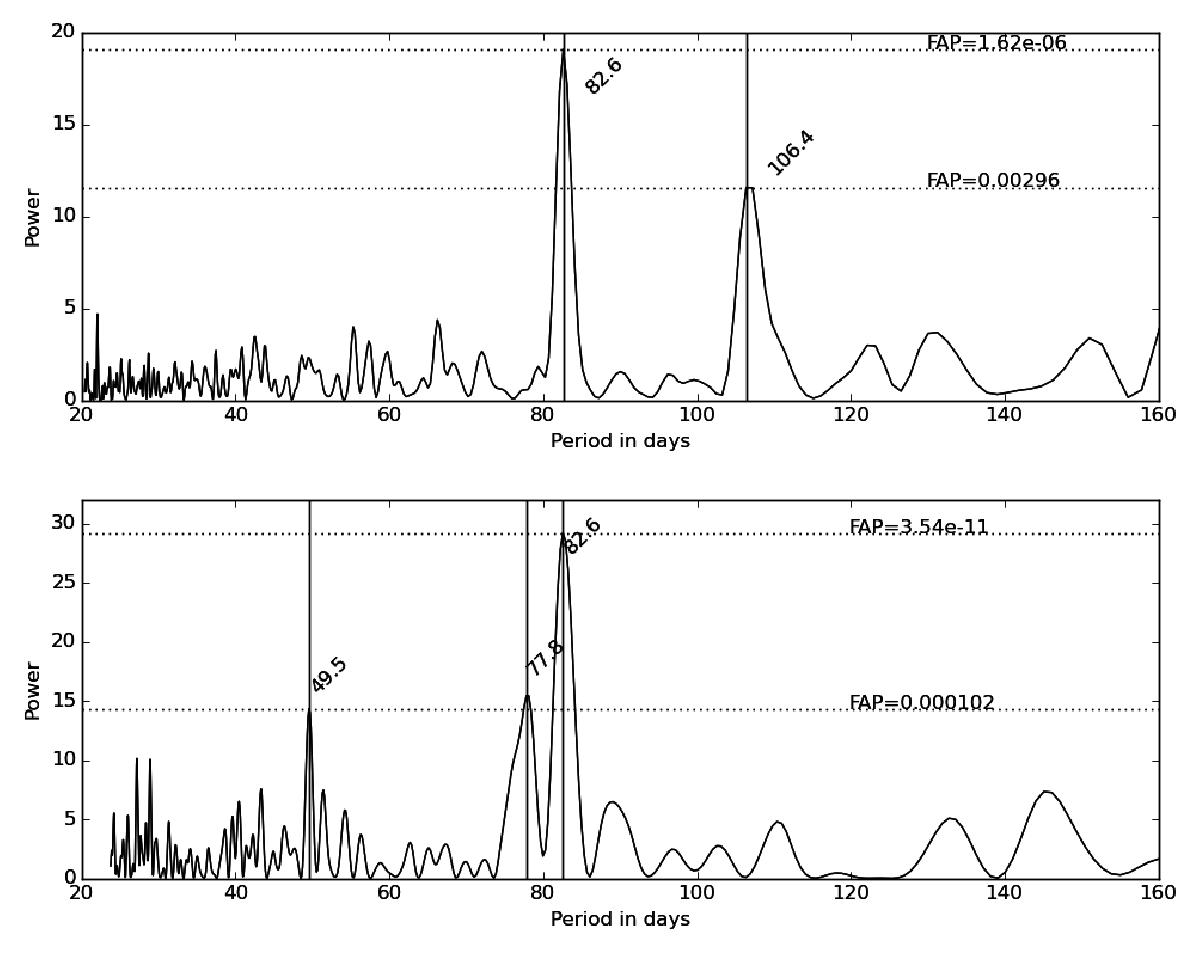
Upper panel: periodogram derived from the ASAS database for Proxima Centauri second aperture, binned to 1 day. Lower panel: periodogram derived from the HST data discussed in Benedict et al. (1998). FAP values for the strongest peaks were calculated and are shown as the dotted lines. Both periodograms are computed using the using the Numerical Recipes Lomb-Scargle routine.
Current usage metrics show cumulative count of Article Views (full-text article views including HTML views, PDF and ePub downloads, according to the available data) and Abstracts Views on Vision4Press platform.
Data correspond to usage on the plateform after 2015. The current usage metrics is available 48-96 hours after online publication and is updated daily on week days.
Initial download of the metrics may take a while.