Fig. A.1

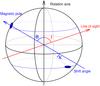
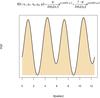
Upper panel: example of a simulated double-peaked light curve ![]() with pulsed fractions of each component f1,2 of a periodic signal with the period of P, (right panel) and the geometry of the model (left panel). Lower panel: distribution of phases (rose diagram-a circular histogram plot of a mixed two von Mises distribution (Mardia & Jupp 2009; Connors 1997)
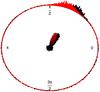
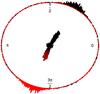
with pulsed fractions of each component f1,2 of a periodic signal with the period of P, (right panel) and the geometry of the model (left panel). Lower panel: distribution of phases (rose diagram-a circular histogram plot of a mixed two von Mises distribution (Mardia & Jupp 2009; Connors 1997) ![]() , with the modes of μ1 = π/ 3,μ2 = π + π/ 3 + π/ 18, concentrations κ1 = 1.2, κ2 = 1.5, and proportion p = 0.45) for approximately 2500 photon arrival times for an ideal Poissonian process (right panel) for a periodic signal with a count rate similar to that observed from RX J0720.4−3125. The histogram plot displays directional data and the frequency of each class. Distribution of the phases assumes that the period is equal to half of the true one (left panel).
, with the modes of μ1 = π/ 3,μ2 = π + π/ 3 + π/ 18, concentrations κ1 = 1.2, κ2 = 1.5, and proportion p = 0.45) for approximately 2500 photon arrival times for an ideal Poissonian process (right panel) for a periodic signal with a count rate similar to that observed from RX J0720.4−3125. The histogram plot displays directional data and the frequency of each class. Distribution of the phases assumes that the period is equal to half of the true one (left panel).
Current usage metrics show cumulative count of Article Views (full-text article views including HTML views, PDF and ePub downloads, according to the available data) and Abstracts Views on Vision4Press platform.
Data correspond to usage on the plateform after 2015. The current usage metrics is available 48-96 hours after online publication and is updated daily on week days.
Initial download of the metrics may take a while.