Fig. 9
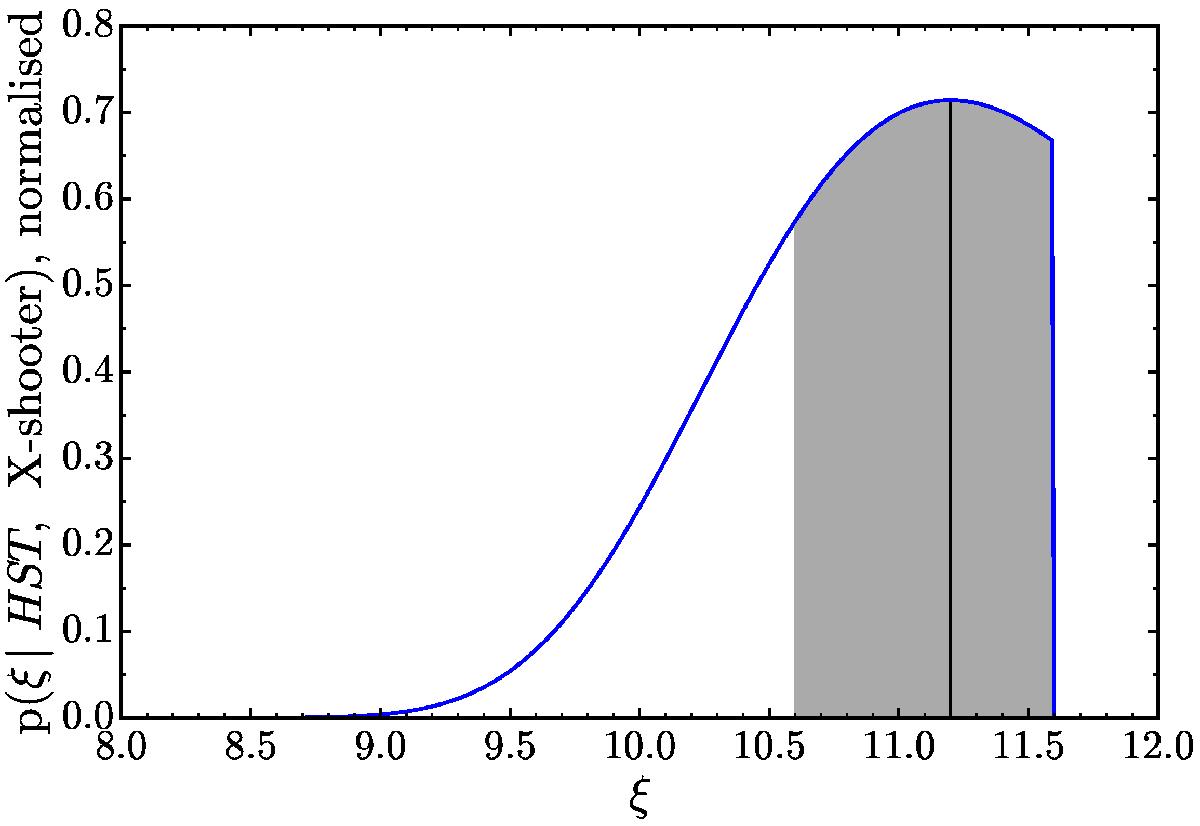
Posterior distribution for ξ, constrained by photometry and spectroscopy. The 68% highest posterior density credible interval is shaded and the peak of the distribution is indicated at ξ = 11.2. The cut-off at ξ = 11.6 arises from determining a lower limit to the i814 flux from the transmission spectrum derived in Sect. 2.1.
Current usage metrics show cumulative count of Article Views (full-text article views including HTML views, PDF and ePub downloads, according to the available data) and Abstracts Views on Vision4Press platform.
Data correspond to usage on the plateform after 2015. The current usage metrics is available 48-96 hours after online publication and is updated daily on week days.
Initial download of the metrics may take a while.