Fig. 8
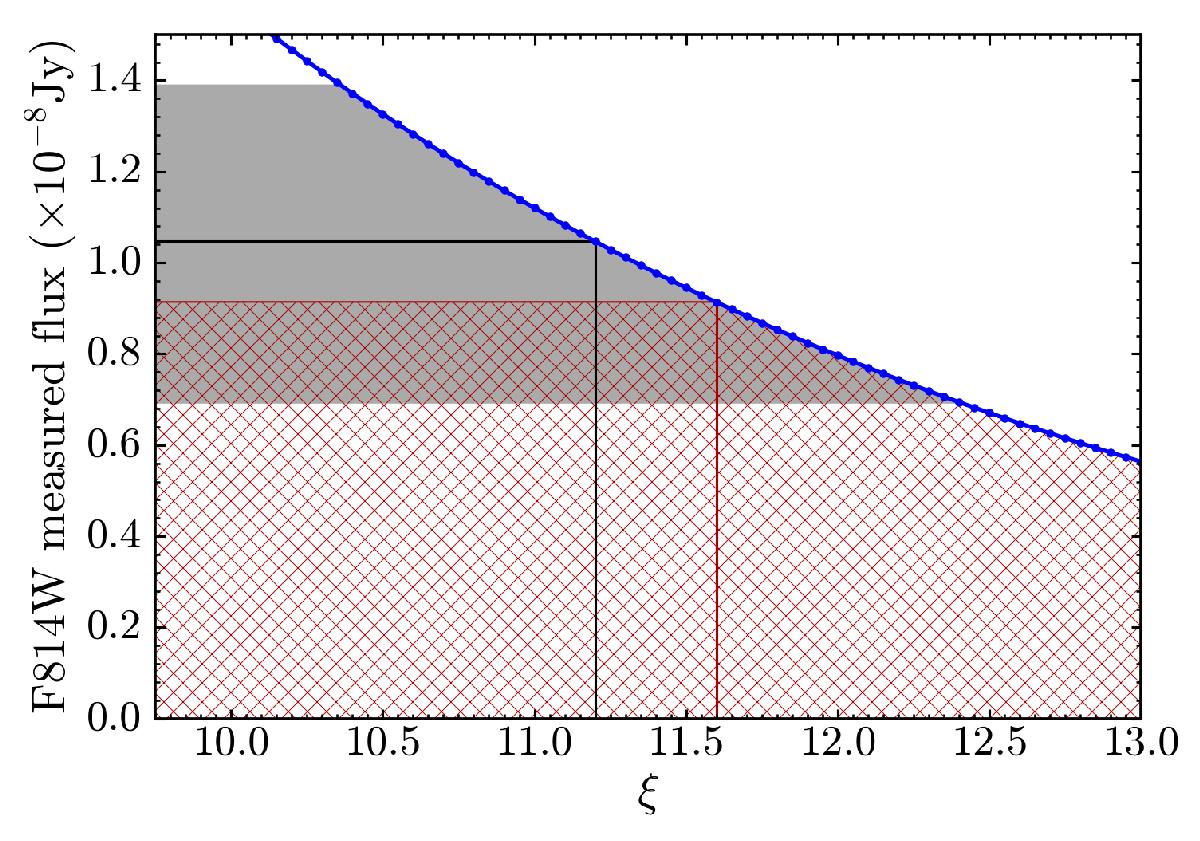
Synthetic F814W photometry measured by determining ![]() from different values of ξ (Eq. (1)) is indicated by the blue points. The solid black line represents the F814W flux in the HST ACS frame. The 1σ range for the HST measurement is shaded grey. The red hatching indicates the hard lower limit on the measured F814W flux imposed by the X-shooter spectrum. The vertical red line indicates the resulting upper limit on ξ.
from different values of ξ (Eq. (1)) is indicated by the blue points. The solid black line represents the F814W flux in the HST ACS frame. The 1σ range for the HST measurement is shaded grey. The red hatching indicates the hard lower limit on the measured F814W flux imposed by the X-shooter spectrum. The vertical red line indicates the resulting upper limit on ξ.
Current usage metrics show cumulative count of Article Views (full-text article views including HTML views, PDF and ePub downloads, according to the available data) and Abstracts Views on Vision4Press platform.
Data correspond to usage on the plateform after 2015. The current usage metrics is available 48-96 hours after online publication and is updated daily on week days.
Initial download of the metrics may take a while.