Fig. 7
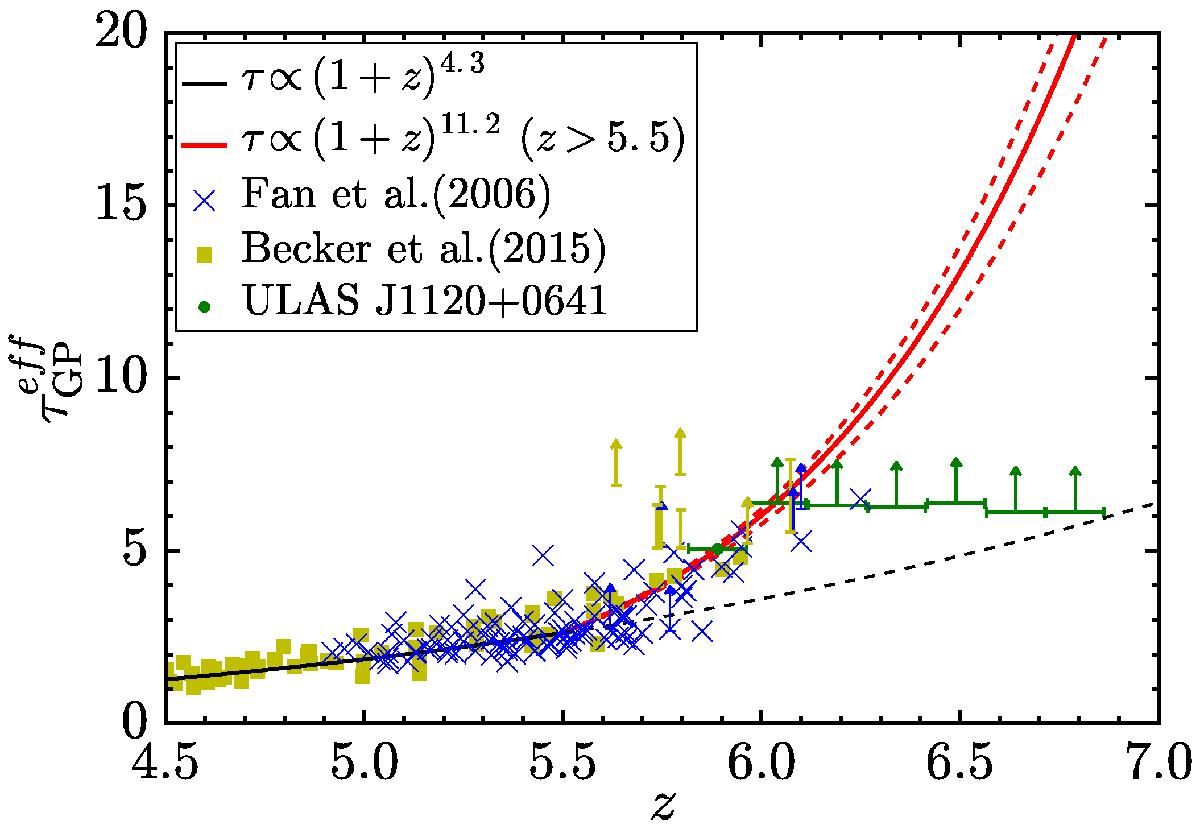
Evolution of ![]() with redshift as predicted by Eq. (1)(solid lines). The red curve is determined using ULAS J1120+0641 data alone and assumes a fixed normalization at z = 5.5. The uncertainty in ξ for z> 5.5 is indicated by the red dashed lines. The black dashed curve indicates the expected optical depth if the low-redshift case were to continue indefinitely. Points indicate direct measurements of
with redshift as predicted by Eq. (1)(solid lines). The red curve is determined using ULAS J1120+0641 data alone and assumes a fixed normalization at z = 5.5. The uncertainty in ξ for z> 5.5 is indicated by the red dashed lines. The black dashed curve indicates the expected optical depth if the low-redshift case were to continue indefinitely. Points indicate direct measurements of ![]() along different lines of sight.
along different lines of sight.
Current usage metrics show cumulative count of Article Views (full-text article views including HTML views, PDF and ePub downloads, according to the available data) and Abstracts Views on Vision4Press platform.
Data correspond to usage on the plateform after 2015. The current usage metrics is available 48-96 hours after online publication and is updated daily on week days.
Initial download of the metrics may take a while.