Free Access
Fig. 10
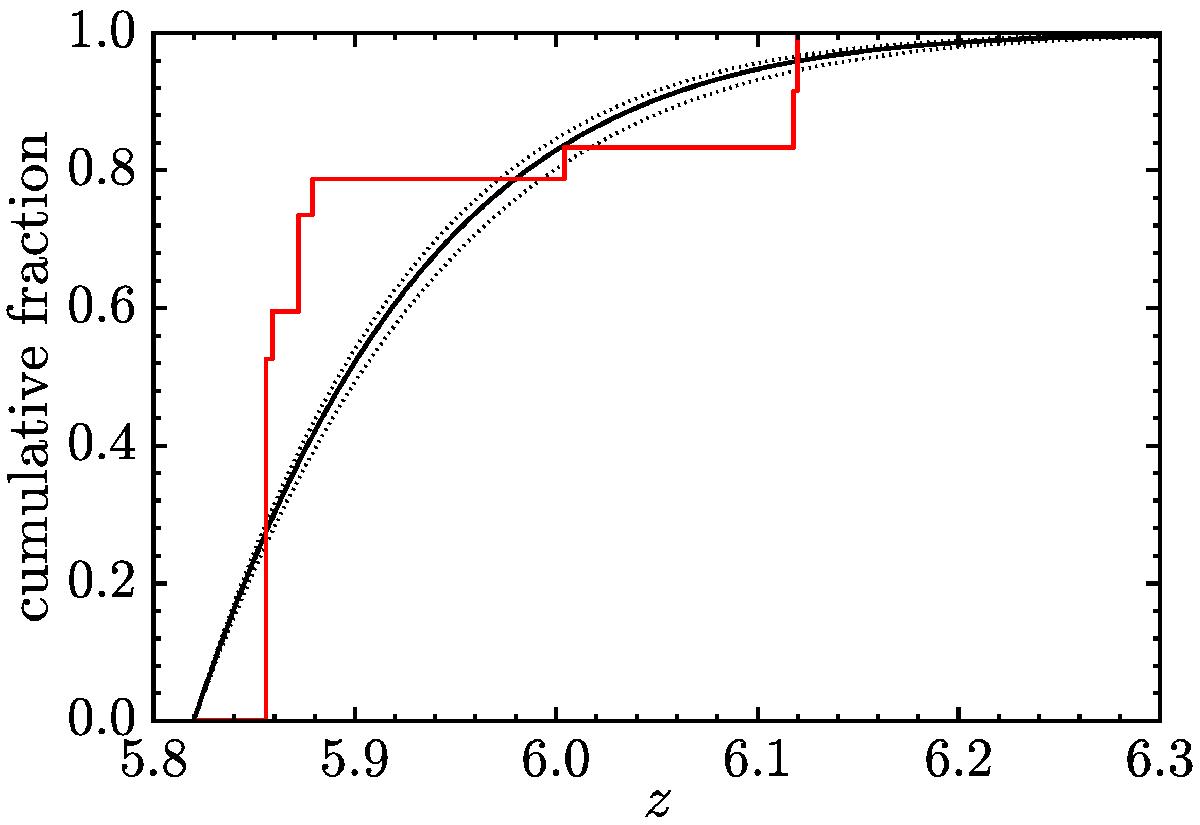
Cumulative distribution of Lyα forest flux contained in the detected transmission spikes (red), compared with the expected distribution of flux transmission based on our model for optical depth with ξ = 11.2 (black; Sect. 4.1). The dashed black lines indicate the uncertainty on our model for ![]() .
.
Current usage metrics show cumulative count of Article Views (full-text article views including HTML views, PDF and ePub downloads, according to the available data) and Abstracts Views on Vision4Press platform.
Data correspond to usage on the plateform after 2015. The current usage metrics is available 48-96 hours after online publication and is updated daily on week days.
Initial download of the metrics may take a while.