Fig. 5
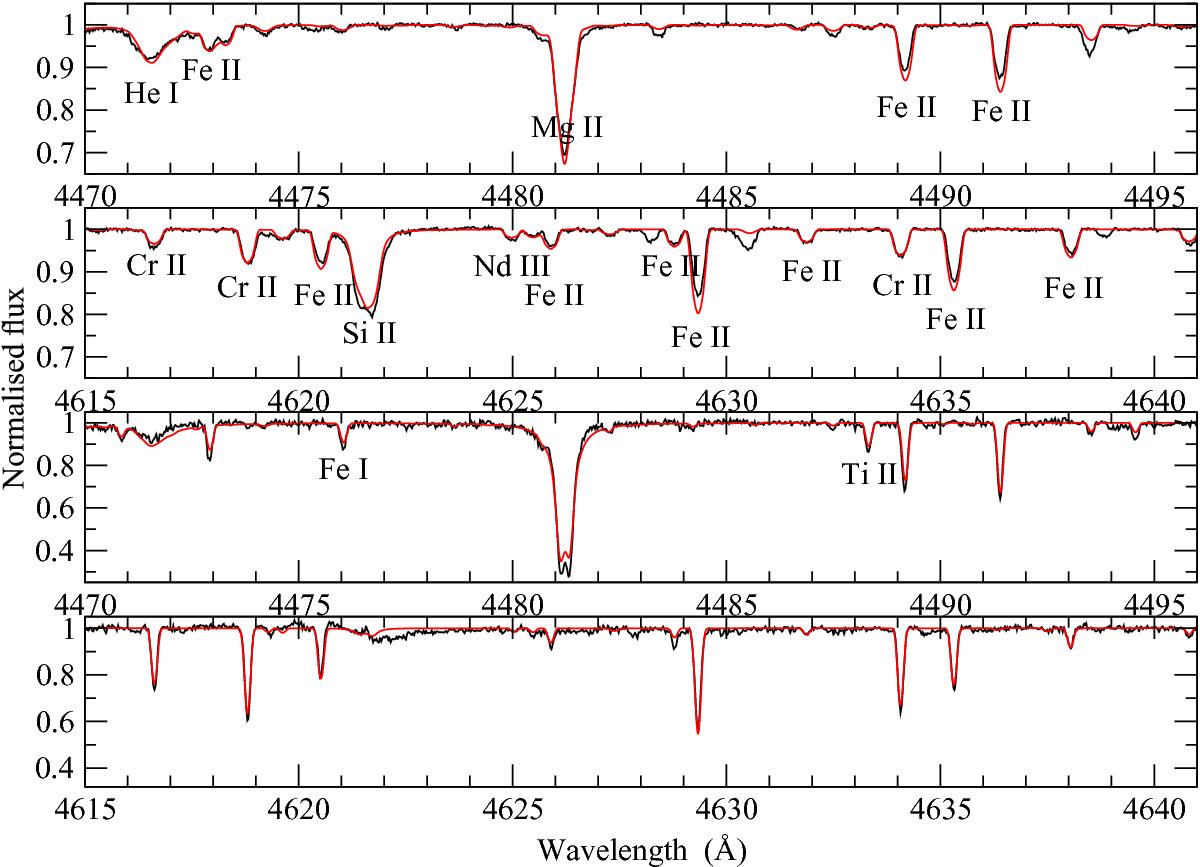
Small sections of the best fits found by zeeman.f to the disentangled mean spectrum of BD-19 5044L A (upper two panels) and BD-19 5044L B (lower two panels). The observed spectra are the (black) curves with noise; the computed spectra (red) have no noise. Ion identifications are provided for the stronger lines in the upper two panels; these generally apply to the corresponding lines in the lower two panels.
Current usage metrics show cumulative count of Article Views (full-text article views including HTML views, PDF and ePub downloads, according to the available data) and Abstracts Views on Vision4Press platform.
Data correspond to usage on the plateform after 2015. The current usage metrics is available 48-96 hours after online publication and is updated daily on week days.
Initial download of the metrics may take a while.