Free Access
Fig. 2
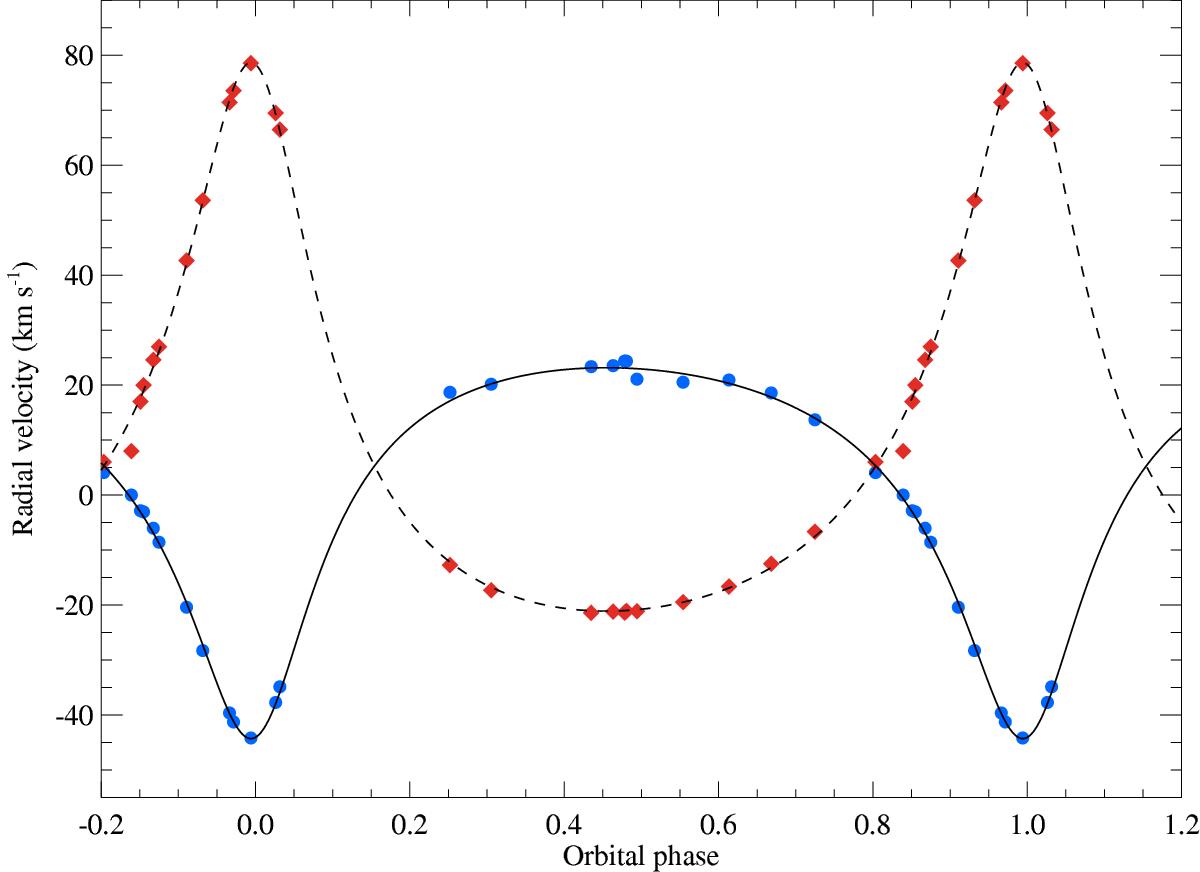
Radial velocity curves as a function of orbital phase measured relative to the velocity extremum, using the best period of 17.63011 d. The velocities of the primary are plotted with blue circles, those of the secondary as red diamonds. Smooth curves are from the model discussed in the text.
Current usage metrics show cumulative count of Article Views (full-text article views including HTML views, PDF and ePub downloads, according to the available data) and Abstracts Views on Vision4Press platform.
Data correspond to usage on the plateform after 2015. The current usage metrics is available 48-96 hours after online publication and is updated daily on week days.
Initial download of the metrics may take a while.