Fig. 1
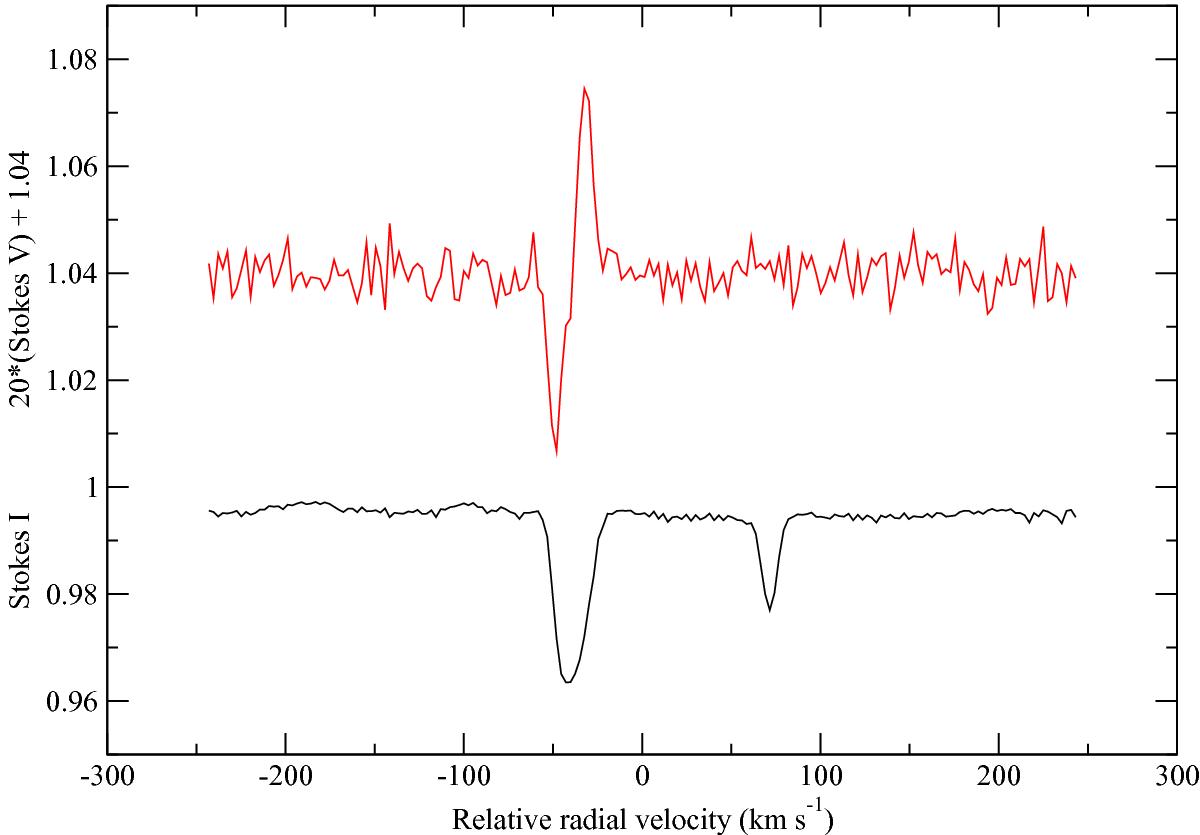
An example of an LSD plot, for the spectrum from CFHT file 1822453pn.s. The lower curve is the mean Stokes I spectral line, with the primary star at −45 km s-1 and the secondary at + 70 km s-1. The lack of symmetry about the line centre of the mean primary line is clearly visible, while the secondary line is both constant in shape and symmetric. The upper curve is the mean Stokes V circular polarisation, multiplied by 20 and shifted upward to + 1.04 for ease of comparison. This Stokes component clearly shows that a field is present in the primary, while no evidence of a field is seen in the secondary.
Current usage metrics show cumulative count of Article Views (full-text article views including HTML views, PDF and ePub downloads, according to the available data) and Abstracts Views on Vision4Press platform.
Data correspond to usage on the plateform after 2015. The current usage metrics is available 48-96 hours after online publication and is updated daily on week days.
Initial download of the metrics may take a while.