Free Access
Fig. 16
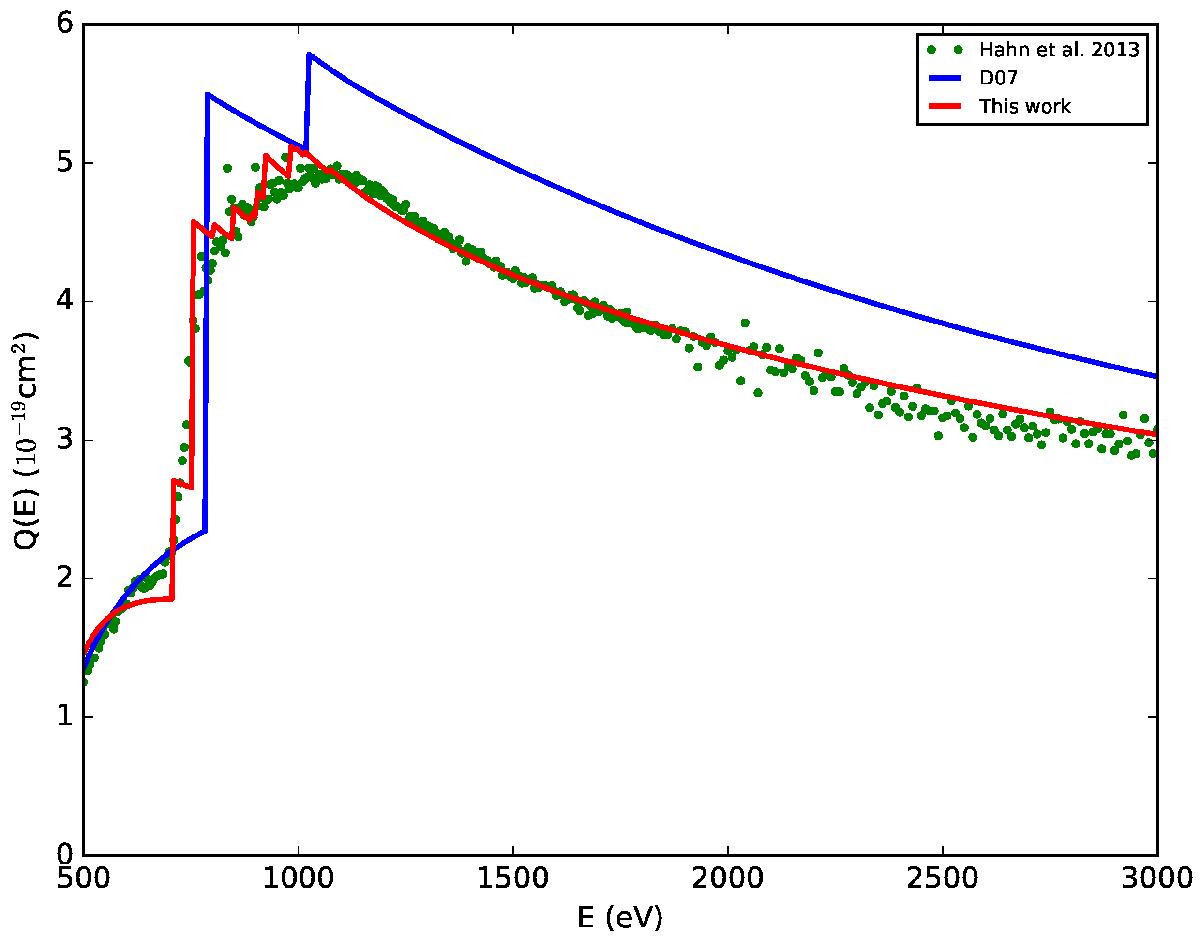
Fe xiv total cross-section. The experimental results of Hahn et al. are shown by the green dots. The theoretical calculations of D07 are given by the blue line and the results of this work derived from the fitting process described in Sect. 3.13 by the red line.
Current usage metrics show cumulative count of Article Views (full-text article views including HTML views, PDF and ePub downloads, according to the available data) and Abstracts Views on Vision4Press platform.
Data correspond to usage on the plateform after 2015. The current usage metrics is available 48-96 hours after online publication and is updated daily on week days.
Initial download of the metrics may take a while.