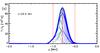
Fig. 5

Temperature difference (T(t)−T(0)) cuts. a) Cuts at x = 0 and z = 26.6 Mm (where the maximum temperature is found) between t = 3.2P (thinnest line) and t = 5P (thickest line). The vertical red dashed lines are the borders of the boundary shell, and the red lines are placed at the location of the maximum gradient of the Alfvén speed at each time. b) Staggered cuts along the z direction on the x = 0 at the initial location of the maximum gradient of the Alfvén speed. The green line follows the location of the maximum temperature increase in both plots.
Current usage metrics show cumulative count of Article Views (full-text article views including HTML views, PDF and ePub downloads, according to the available data) and Abstracts Views on Vision4Press platform.
Data correspond to usage on the plateform after 2015. The current usage metrics is available 48-96 hours after online publication and is updated daily on week days.
Initial download of the metrics may take a while.