Fig. 3

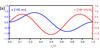
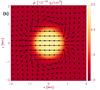
Settings for the driver. a) Time evolution of the cylinder centre footpoint displacement as a function of time (blue line) and the consequent velocity displacement (red line). b) Map of the density of the driver at t = 0.5P with the velocity arrow overplotted. The maximum velocity in the cylinder at this time is V0, according to Table 2.
Current usage metrics show cumulative count of Article Views (full-text article views including HTML views, PDF and ePub downloads, according to the available data) and Abstracts Views on Vision4Press platform.
Data correspond to usage on the plateform after 2015. The current usage metrics is available 48-96 hours after online publication and is updated daily on week days.
Initial download of the metrics may take a while.