Fig. 4
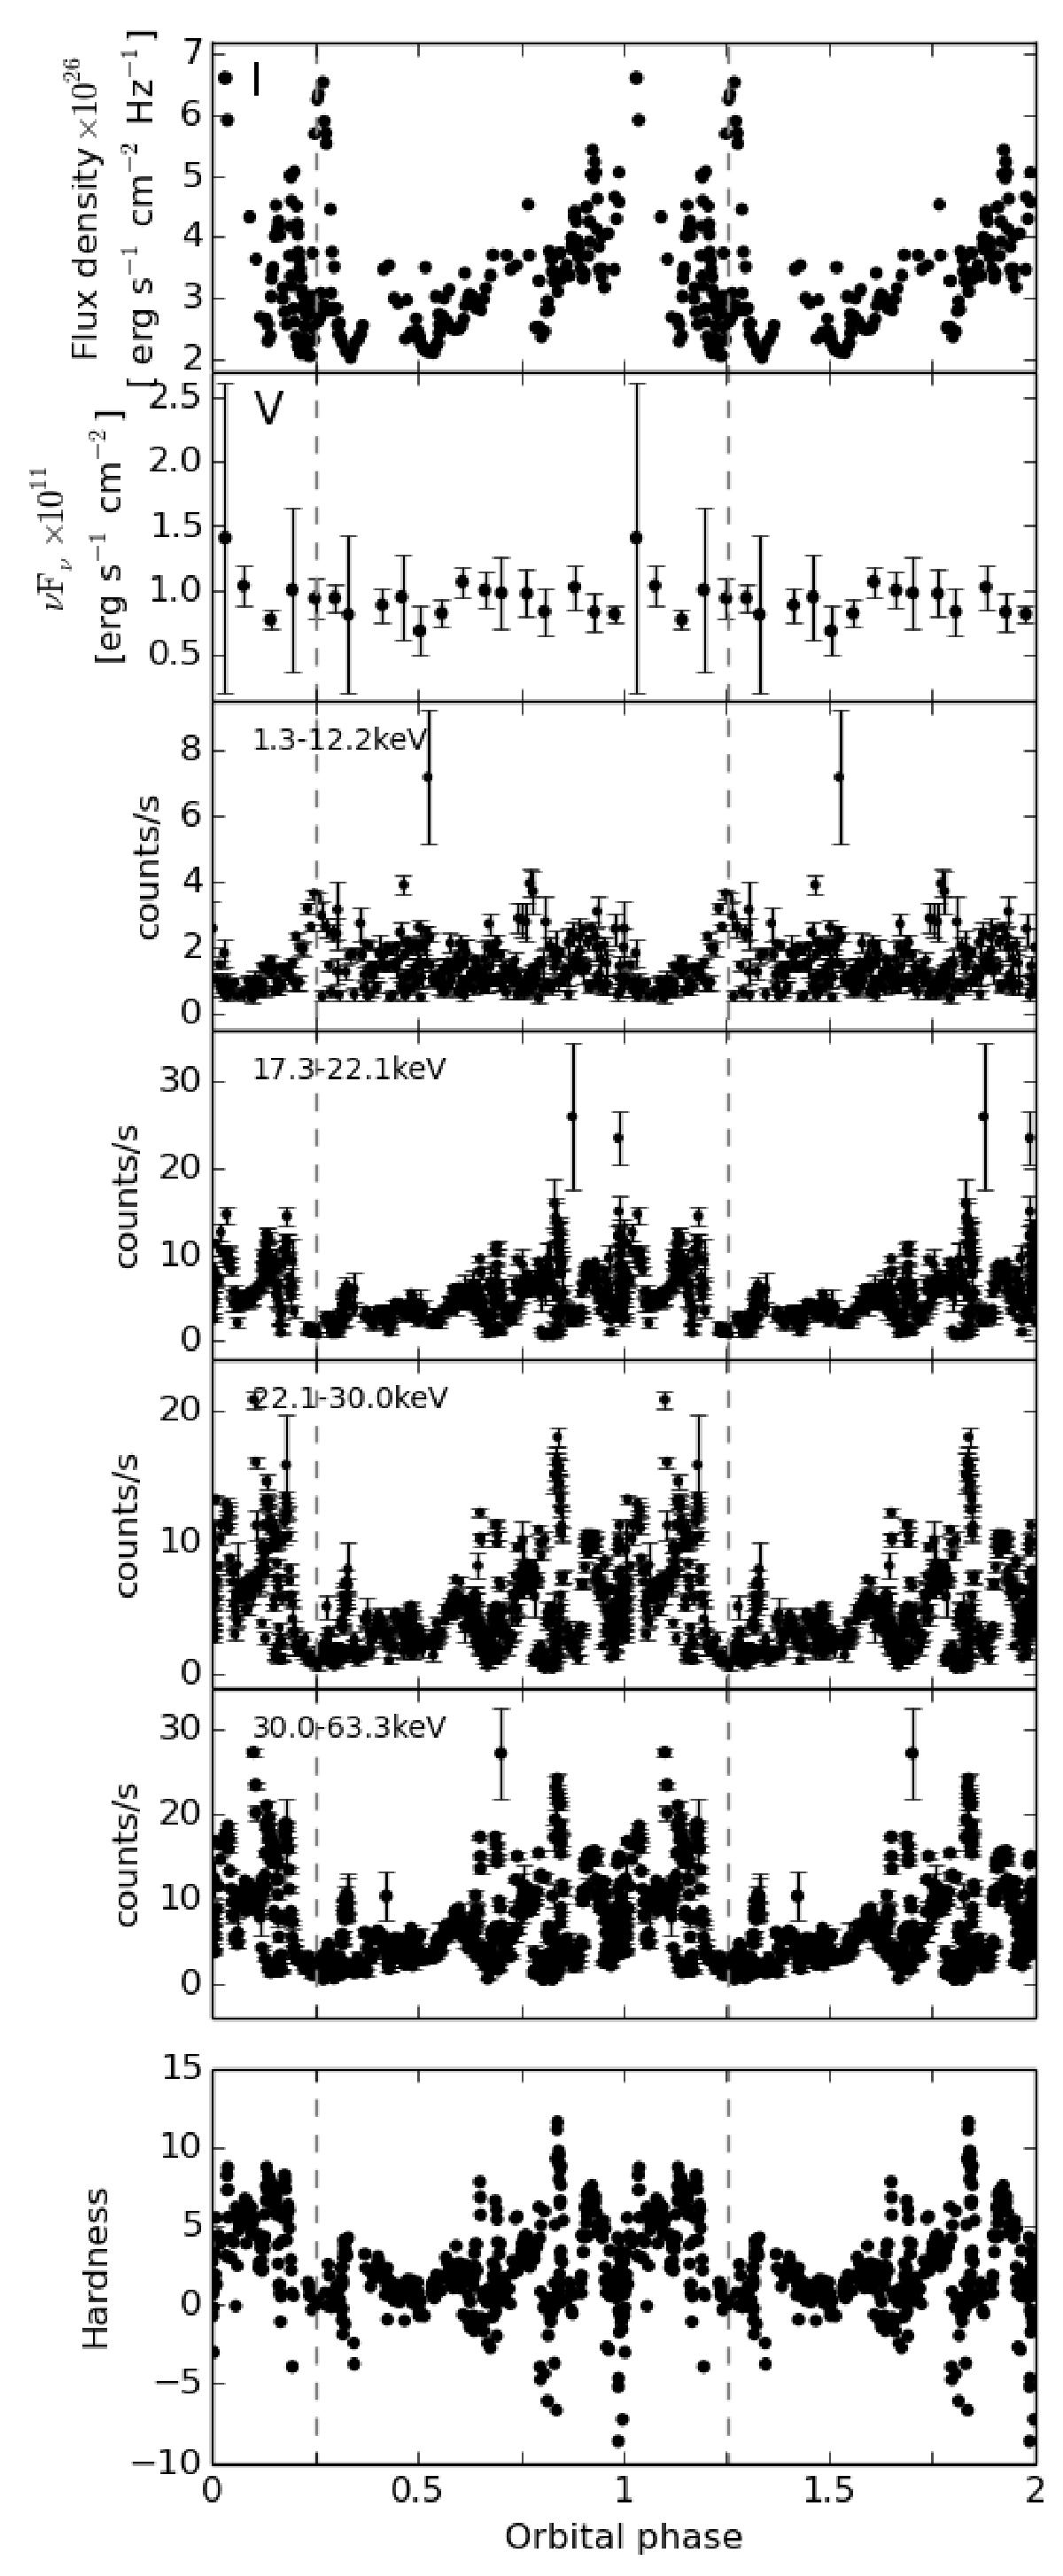
Top five panels: phase plot of GX 1+4 at different spectral ranges with the orbital period of 1160.8 d (Hinkle et al. 2006), where orbital phase φ = 0 corresponds to the time of periastron passage (Eq. (1)). The vertical gray lines are times of neutron star eclipse according to Eq. (2). Bottom panel: phase plot of hardness of GX 1+4. The hardness is defined as a difference between count rate in 30.0–63.3 keV range and in 17.3–22.1 keV range.
Current usage metrics show cumulative count of Article Views (full-text article views including HTML views, PDF and ePub downloads, according to the available data) and Abstracts Views on Vision4Press platform.
Data correspond to usage on the plateform after 2015. The current usage metrics is available 48-96 hours after online publication and is updated daily on week days.
Initial download of the metrics may take a while.