Fig. 3
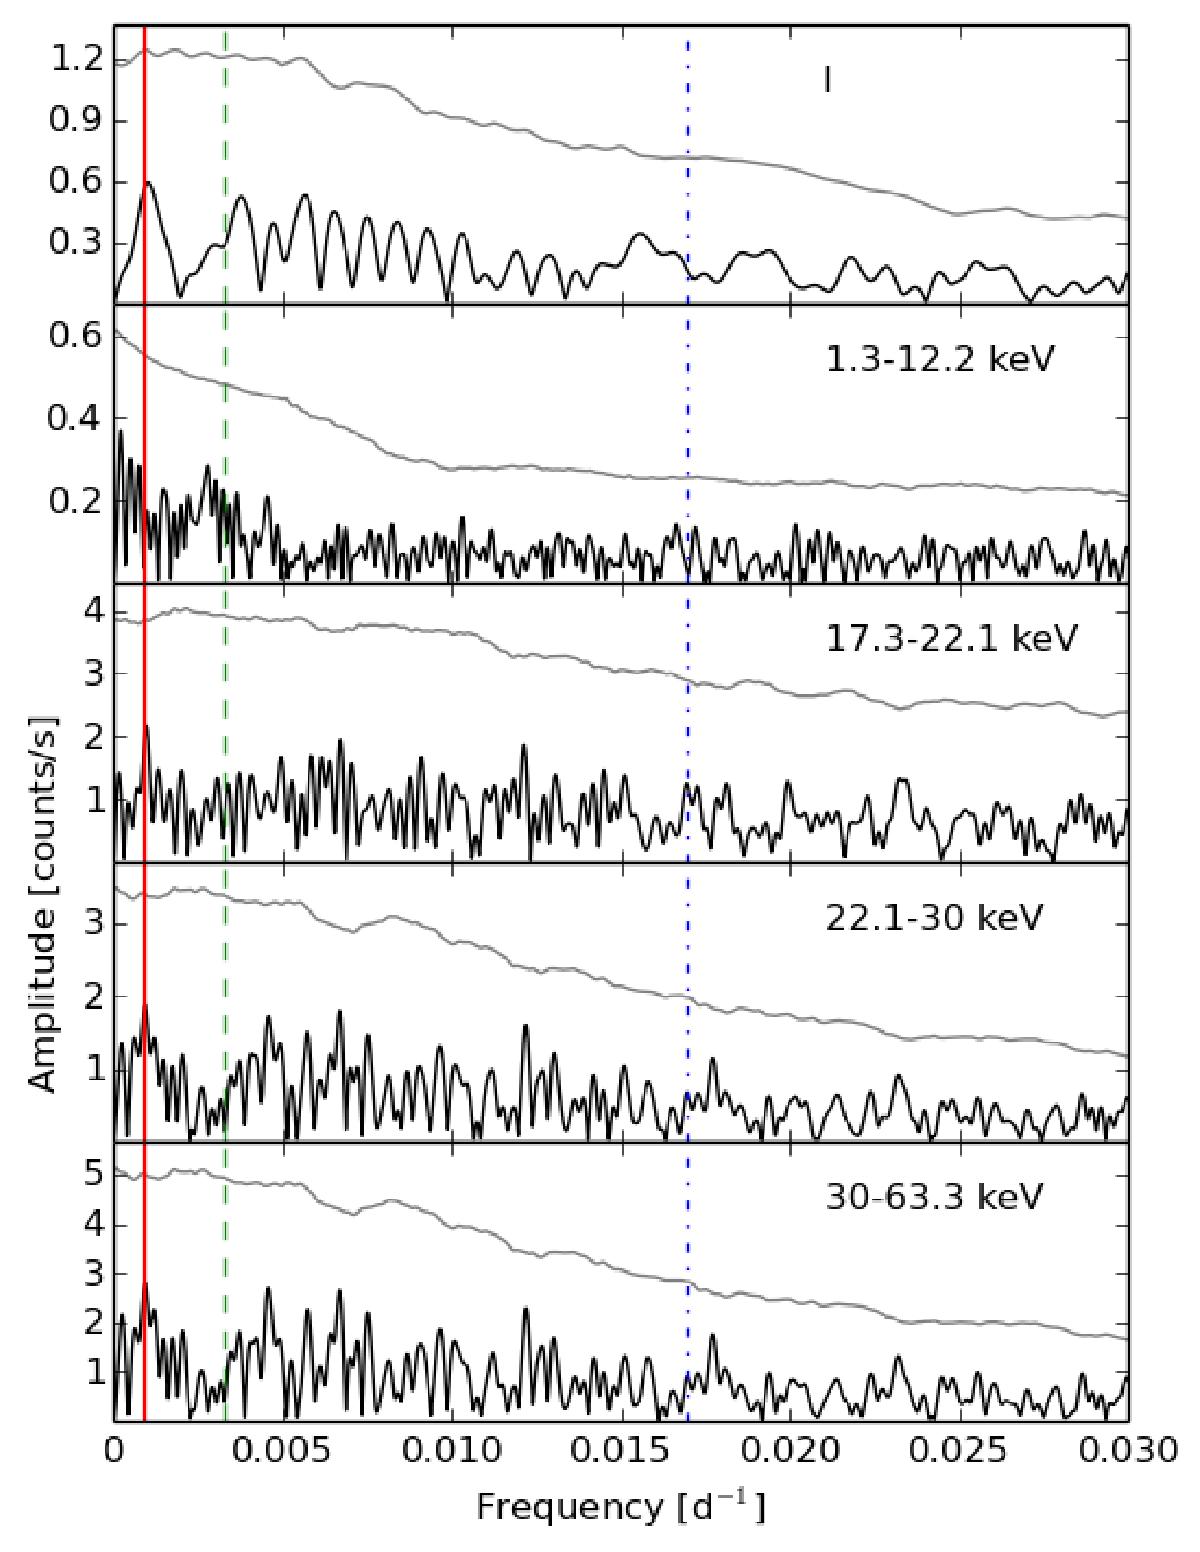
Power spectrum of X-ray observations of GX 1+4 (black lines). The solid red line represents orbital period of 1160.8 d (Hinkle et al. 2006). Dashed green line represent proposed period of 303.8 d (Pereira et al. 1999). Blue dashed-dotted line represents the 59 d period reported by Majczyna et al. (2015). The gray line represents the limit of a significant detection (see text).
Current usage metrics show cumulative count of Article Views (full-text article views including HTML views, PDF and ePub downloads, according to the available data) and Abstracts Views on Vision4Press platform.
Data correspond to usage on the plateform after 2015. The current usage metrics is available 48-96 hours after online publication and is updated daily on week days.
Initial download of the metrics may take a while.