Fig. 2
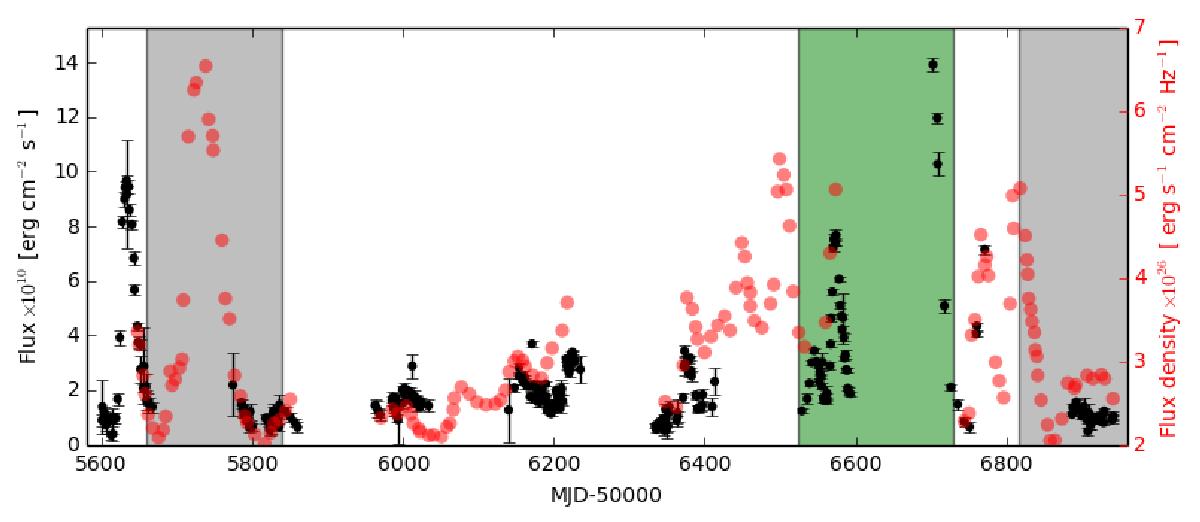
Example of variability on a short timescale in the 30.0–63.3 keV range (black points; left axis) together with observations in the I-band (red points; right axis) scanned from Majczyna et al. (2015). The green area indicates time of periastron passage (Eq. (1)) and the gray areas indicate time of the potential eclipse of the neutron star (Eq. (2)).
Current usage metrics show cumulative count of Article Views (full-text article views including HTML views, PDF and ePub downloads, according to the available data) and Abstracts Views on Vision4Press platform.
Data correspond to usage on the plateform after 2015. The current usage metrics is available 48-96 hours after online publication and is updated daily on week days.
Initial download of the metrics may take a while.