Fig. 9
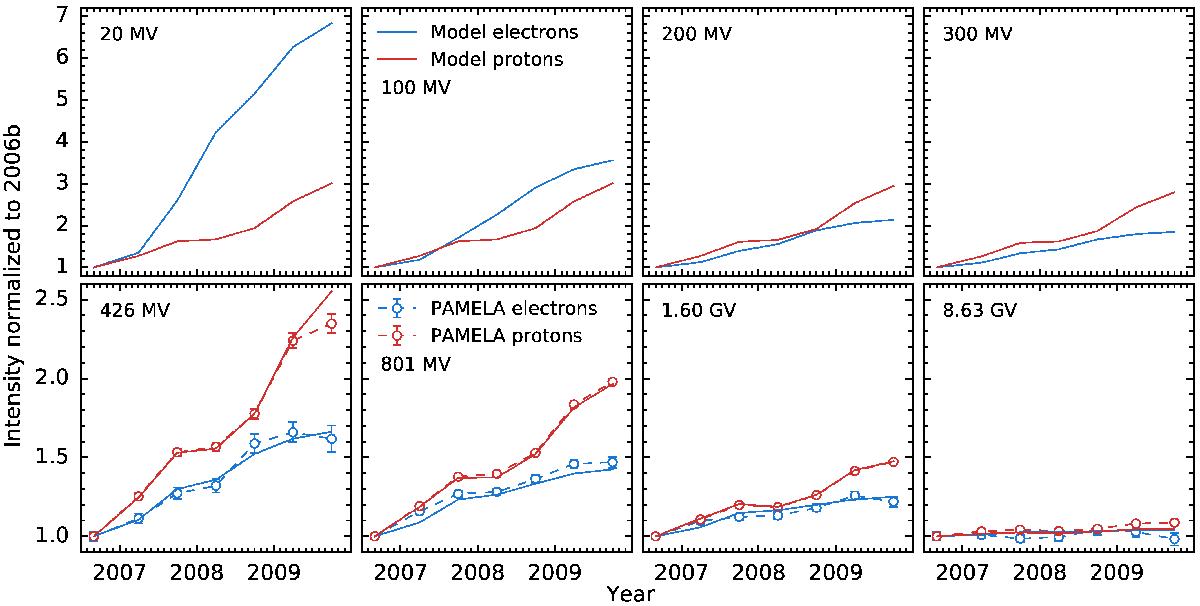
A comparison of the relative intensity increases of electrons (blue lines) and protons (red lines) as a function of time for eight selected rigidities, normalised to the intensity values of 2006b. Lower panel shows a comparison of the observed values (dashed lines with open symbols) and corresponding modelled values for 426 MV, 801 MV, 1.60 GV and 8.63 GV. We note how the difference dissipates with increasing rigidity. In the upper panel, we note the different intensity scale; for 200 MV and 300 MV, the profiles for protons still show a somewhat steeper increase towards 2009 than the electrons, but at 100 MV and 20 MV, the electrons increase far more than the protons, consistent with what was shown in Figs. 4 and 6. The response of electrons at these low rigidities is not related to particle drifts; how drift effects phase out with decreasing rigidity is shown in Fig. 7.
Current usage metrics show cumulative count of Article Views (full-text article views including HTML views, PDF and ePub downloads, according to the available data) and Abstracts Views on Vision4Press platform.
Data correspond to usage on the plateform after 2015. The current usage metrics is available 48-96 hours after online publication and is updated daily on week days.
Initial download of the metrics may take a while.