Fig. 6
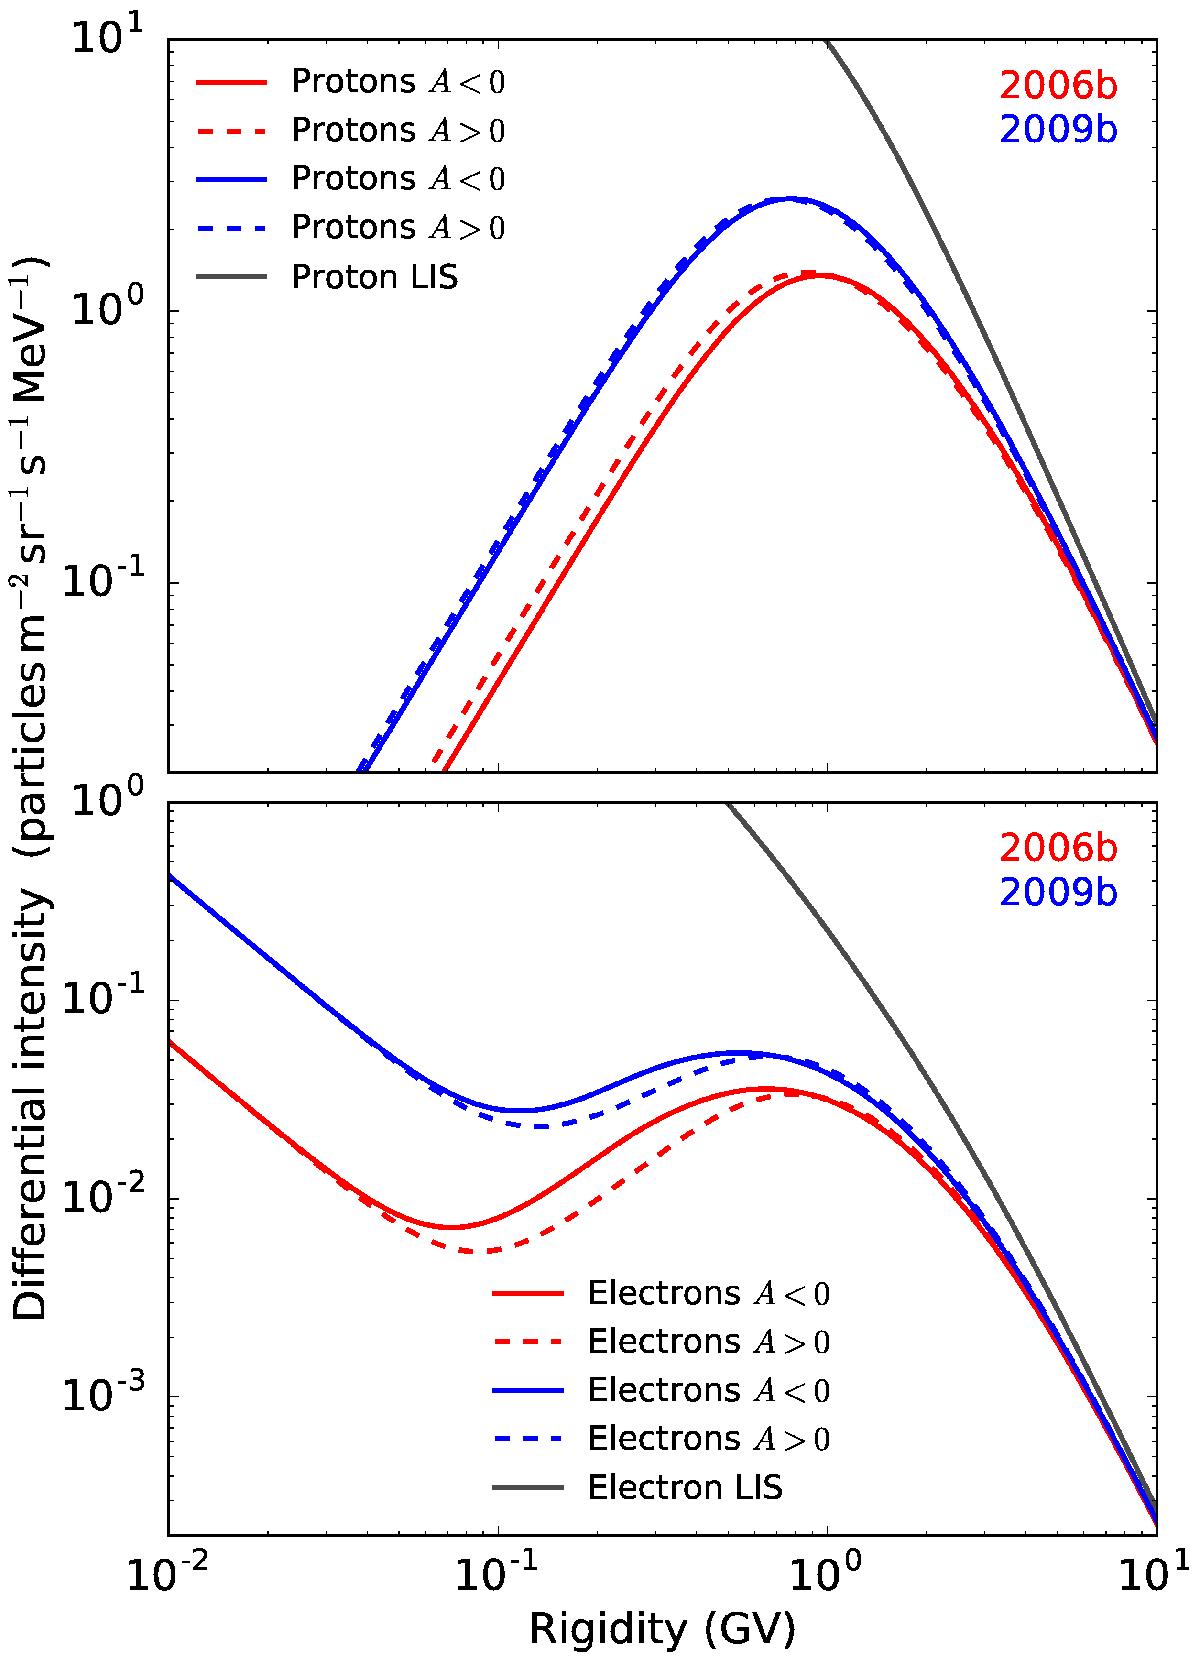
Computed proton (top panel) and electron (bottom panel) rigidity spectra are shown for the A < 0 (solid lines) and the A > 0 (dashed lines) polarity cycles. The 2006b and 2009b periods are represented by the red and blue colours. Solid grey lines are the proton and electron VLIS from Fig. 1. The dashed lines are, in fact, predictions of what may be observed during the upcoming A > 0 solar minimum period if similar conditions would prevail then as in 2006 to 2009.
Current usage metrics show cumulative count of Article Views (full-text article views including HTML views, PDF and ePub downloads, according to the available data) and Abstracts Views on Vision4Press platform.
Data correspond to usage on the plateform after 2015. The current usage metrics is available 48-96 hours after online publication and is updated daily on week days.
Initial download of the metrics may take a while.